Facts + Statistics: Homeowners and Renters Insurance
Cited in 2 Likelier entries (2 risks, 0 decisions).
Used in 2 entries
For each citing entry, the verbatim excerpt and Likelier's calculation notes (how the source's number was converted to the lifetime-probability framing) are shown below. Click through to read the full claim ledger.
-
- Statistic
1 in 67 insured homes files a water damage or freezing claim per year (2019-2023); average claim amount $15,400; water damage and freezing accounts for 22.6% of homeowners losses in 2023
“"(Weighted average, 2019-2023) Cause of loss Claim frequency (2) Claim severity (3) … Water damage and freezing 1.50 15,400 … Water damage and freezing 28.7 19.8 23.7 25.8 22.6"”
Calculation notes
The 1 in 67 annual rate (1.493%) is the primary input for this entry's normalization. Over 40 years of homeownership: 1 - (1-0.01493)^40 = 0.452, approximately 1 in 2.2. Average claim of $15,400 is the loss severity anchor. The 22.6% share of all homeowners losses confirms water damage/freezing is the second-largest loss category after wind and hail.
Independence note: III compiles ISO (Verisk Analytics) data from homeowners multiple peril (HO-3) policies. ISO is the primary upstream; III is the public-facing aggregator. These are treated as the same institutional data pipeline.
Source date: 2024-01-01 · Accessed: 2026-05-10
-
- Statistic
About one in 36 insured homes has a property damage claim related to wind or hail; 2.8% of insured homes experienced a wind/hail loss over 2019-2023, average claim severity $14,747
“"In the five-year period, 2019-2023, 5.6 percent of insured homes had a claim. Wind and hail accounted for the largest share of claims, with 2.8 percent of insured homes having such a loss … About one in 36 insured homes has a property damage claim related to wind or hail."”
Calculation notes
The III "1 in 36" figure (~2.78%/yr) combines wind and hail damage claims and serves as an upper-bound cross-check. The NICB-derived homeowner-only hail rate of 0.67%/yr is lower because it is hail-specific and excludes straight-line wind damage. The average wind/hail severity of $14,747 (2019-2023) is used for context; the primary rate estimate derives from the NICB homeowner-specific hail claims count. Used as a cross-check only, not as a basis for the normalized probability. The archived copy dated 2026-05-18 covers 2019-2023 (5.6 percent of insured homes with a claim); an earlier edition of the same page covered 2018-2022 (5.8 percent with a claim, 2.8 percent from wind and hail, average wind/hail severity $13,511).
Independence note: III homeowners loss data is compiled from insurer filings aggregated through ISO; methodologically independent from NICB ISO ClaimSearch claims-count data, though both ultimately trace to insurance company reporting.
Source date: 2025-01-01 · Accessed: 2026-05-14
Also cited in these entries

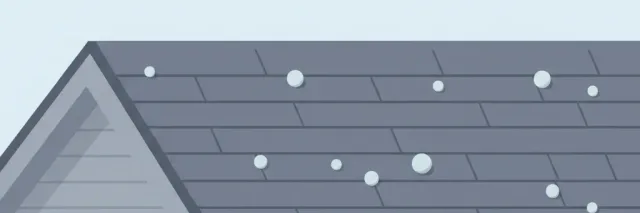
Hail roof damage
What are the odds that hail will seriously damage your roof during your lifetime?