Evidence quality 4.75/5
Eight-dimension review score against the quality rubric . Each dimension scored 1–5.
- D1 Source grounding
- 5/5
- D2 Source authority
- 5/5
- D3 Arithmetic
- 5/5
- D4 Uncertainty
- 4/5
- D5 Scope
- 5/5
- D6 Prose
- 4/5
- D7 Perception honesty
- 5/5
- D8 Caveat completeness
- 5/5
● your factors — click this risk ▾ to reveal
- Your factors
≈ As likely as
Perceived
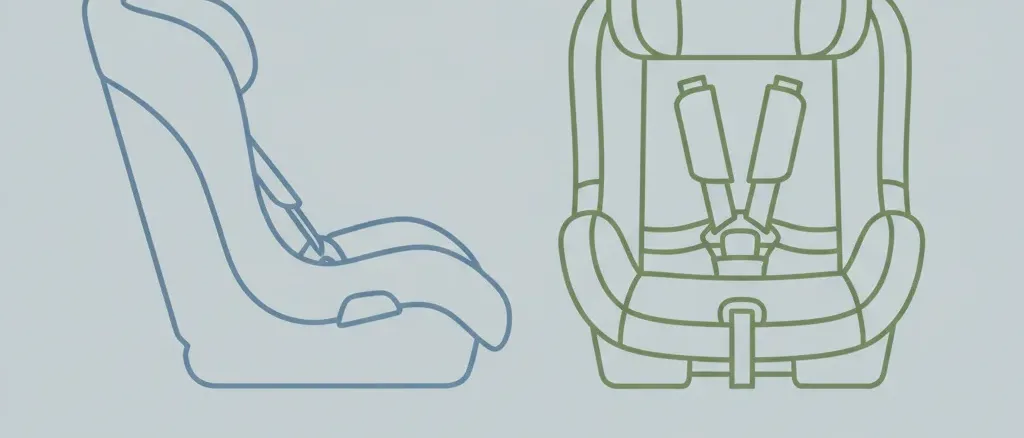
"Keep them rear-facing as long as possible" is one of the most repeated lines in modern car-seat culture, and the number attached to it — that a rear-facing seat is "five times safer" — is one of the stickiest statistics in parenting. The felt consequence of turning a one- or two-year-old forward-facing too early is a large, specific jump in the odds of a fatal injury: parents picture the milestone decision as trading away most of a child's crash protection. The five-fold figure is treated as settled fact in seat marketing, pediatric handouts, and parenting forums, and few of the people repeating it know that the study it came from was formally retracted.
Rough estimate: Most parents believe forward-facing 'too early' multiplies death risk several-fold — the '5x safer' number is the anchor
Source: editorial intuition, not polled
Actual
137 US passenger-vehicle-occupant deaths among children ages 1-3 (2022)
US children ages 1-3 riding as passenger-vehicle occupants
Show derivation
Scope is a US toddler across the ages 1-3 window, not US-adult-lifetime. NHTSA's Traffic Safety Facts (2022 Children) report that of 756 child passenger-vehicle occupants killed, 137 were children aged 1 to 3 — an OCCUPANT-only count. This is distinct from the ~211 all-traffic fatalities for ages 1-3, which additionally include child pedestrians and pedalcyclists and must not be used as an occupant number (an easy and consequential mislabel). Against a US population of roughly 11 million children aged 1-3 (three single-year birth cohorts near 3.6-3.7 million each), 137 occupant deaths per year is about 1.25 per 100,000 per year. Compounded across the three-year window (1 - (1 - 1.245e-5)^3 ≈ 3.74e-5), the per-toddler probability of dying as a car occupant between the first and fourth birthday is roughly 1 in 27,000. This is the ABSOLUTE occupant-death baseline for a toddler regardless of seat orientation; the rear-facing versus forward-facing decision moves it by an amount the US field crash data cannot reliably quantify (see caveats). The uncertainty band brackets a well-restrained, best-practice lower bound (~1 in 50,000) and an unrestrained or poorly-restrained upper bound (~1 in 10,000).
Caveats: This entry deliberately headlines the ABSOLUTE occupant-death risk for a toddler…
This entry deliberately headlines the ABSOLUTE occupant-death risk for a toddler rather than the rear-versus-forward-facing MARGIN, because the margin cannot be honestly quantified from US field data. Two numeric traps are worth naming: the headline uses the 137 OCCUPANT deaths for ages 1-3 (2022), not the larger ~211 all-traffic count that also folds in child pedestrians and cyclists; and the "rear-facing is five times safer" figure comes from Henary et al. (Injury Prevention 2007), which was formally retracted. The same research group published a 2017 updated assessment (McMurry, Bull, Arbogast) that found rear-facing children directionally safer but statistically non-significant, stating plainly that "we cannot associate a specific number or figure to that safety benefit." Anderson et al. (2019) show why: restraint direction is unrecorded in 63.3% of the restrained fatal cases, so the US crash census cannot resolve a rear-vs-forward mortality ratio at all. For that reason NO orientation multiplier is assigned here — assigning one would fabricate precision the evidence does not contain. The direction of the effect is not in dispute: AAP, NHTSA, and biomechanical and sled-test research all support keeping a child rear-facing as long as the seat allows, and the 2018 AAP policy recommends exactly that (it dropped the hard age-2 milestone in favor of "as long as possible"). What is in dispute is the magnitude, and the honest answer is that it is real but unmeasured in the field. The measurable protection lives elsewhere: using a seat at all (~2.9x mortality unrestrained), installing and using it correctly (AAP: up to 71% death reduction for a correct seat, against an estimated ~80% of seats installed or used incorrectly), a belted driver, and the back seat over the front (an independently supported but modest effect, below the threshold to list as a multiplier here). Scope is a US toddler across ages 1-3 as a passenger-vehicle occupant; the number excludes child pedestrians and cyclists, and the marginal orientation benefit is treated as directionally protective but not reliably estimable.
How the risk varies
The headline figure averages across very different situations. Here’s how the probability varies by scenario or context:
1 in 50,000
Lower bound: a correctly installed and used child seat with a belted driver puts a toddler near the bottom of the band. AAP puts correct-seat death reduction at up to 71% versus no restraint.
1 in 26,738
The great majority of US children ages 1-3 are restrained on any given trip, so the population baseline sits close to, but slightly above, the best-practice floor.
1 in 10,000
Upper bound: FARS records nearly triple the mortality (40.0% vs 13.7%) for unrestrained versus restrained toddlers in fatal crashes. 26% of the ages-1-3 occupant deaths with known restraint status involved an unrestrained child.
Bar length and shade rank these scenarios against each other, not against other risks. The exact odds are shown beside each.
Related risks
Other risks on similar themes — for exploring related fears.


Bouncer chair fall
What are the odds an infant in a bouncer chair falls when the chair is placed on an elevated surface?

Magnet ingestion
What are the odds of a child swallowing multiple high-powered magnets and needing hospitalization?

Unsupervised infant choking
What are the odds of a choking emergency if an infant eats unsupervised?

Child bike trailer
What are the odds of serious injury to a child riding in a towed bicycle trailer?


Pick challenger
In 2022, of the 756 US children killed as passenger-vehicle occupants, 137 were toddlers aged one to three, according to NHTSA’s Traffic Safety Facts. Against roughly 11 million US children in that age band, that is a per-toddler probability on the order of 1 in 27,000 of dying as a car occupant across the three years from the first to the fourth birthday. It is worth being careful with the number: the larger figure of about 211 fatalities for ages 1-3 that circulates is the all-traffic count, which folds in child pedestrians and cyclists, and it is not the occupant risk a car seat addresses. Cars are a leading injury killer of American children, but the per-child-year occupant death rate is low, and NHTSA records that 26% of the ages-1-3 occupant deaths with known restraint status involved a child who was not buckled at all. Restraint status, not the finer question of which way the seat faces, is what separates most of the fatalities from the survivors.
The number parents actually carry, though, is not the absolute risk. It is “rear-facing is five times safer,” and that figure has a history worth knowing. It comes from Henary and colleagues in Injury Prevention in 2007, a study that became the evidentiary backbone of the “rear-facing until age 2” rule. In 2017 the same research group published an updated assessment that re-ran the analysis and could not reproduce it: rear-facing children still looked directionally safer, but the difference no longer reached statistical significance, and the authors stated flatly that “we cannot associate a specific number or figure to that safety benefit.” The original paper was formally retracted. Anderson and colleagues showed why the field data is so weak on this specific question in 2019: across 4,966 rear-seated infants and toddlers in fatal crashes from 2008 to 2015, the direction of the restraint — rear or forward — was simply not recorded in 63.3% of the restrained cases. The US crash census cannot put a ratio on rear-versus-forward because it mostly did not write the direction down.
None of that makes the recommendation wrong. The direction of the effect is not in dispute — crash biomechanics, sled testing, and Scandinavian field data all point the same way, and the 2018 American Academy of Pediatrics policy still tells families to keep a child rear-facing “as long as possible,” having dropped the hard age-2 milestone precisely because a weight-and-height limit is the better rule. What changed is the honesty about magnitude: rear-facing longer is low-cost, well-motivated, and universally recommended, but the “five times” number is a retracted artifact, not a measured fact. Likelier tags this entry calibrated rather than debunked for that reason. The measurable protection sits in the parts nobody argues about: using a seat at all, which the FARS data ties to roughly 2.9 times lower mortality; installing and using it correctly, which the AAP links to as much as a 71% reduction in death risk against an estimated four-in-five seats that are misused; a buckled driver; and the back seat over the front. The orientation decision is real and worth getting right, but it is a small, unquantified slice of an already-small number, not the five-fold cliff the folklore describes.
Related tidbits
The "5x safer rear-facing" car-seat stat comes from a 2007 study that was formally retracted — the reanalysis found no significant difference. A US toddler's odds of dying as a car occupant are about 1 in 27,000. Rear-facing is still advised, just not for that number.
Claim ledger
Every number below is what each source reported, with the verbatim quote we relied on and how we arrived at our figure. Click any link to verify directly.
4/4 sources independently verified verbatim against the cited source
-
[1] NHTSA, National Center for Statistics and Analysis — Traffic Safety Facts 2022 Data: Children Verified
Traffic Safety Facts 2022 Data: Children- Statistic
137 US children ages 1-3 killed as passenger-vehicle occupants in 2022 (of 756 total child occupants killed); among ages 1-3 with known restraint, 33 of 126 (26%) were unrestrained- Excerpt
“"Of the 756 child passenger vehicle occupants killed, restraint use was known for 675, of whom 266 (39%) were unrestrained. [...] Of the 137 children 1 to 3 years old killed, restraint use was known for 126, of whom 33 (26%) were unrestrained." ”
- Source data from
- 2024-06-01
- Accessed
- 2026-07-07 · archived copy
- Verification
- Excerpt independently re-fetched and confirmed word-for-word against the cited source during our grounding audit.
- Calculation
- The headline anchor. 137 occupant deaths (ages 1-3, 2022) is the occupant-only figure, deliberately used instead of the ~211 all-traffic ages-1-3 count (which includes pedestrians and pedalcyclists). 137 / ~11 million US children ages 1-3 ≈ 1.25e-5 per year, or about 3.74e-5 compounded across the three-year window (≈ 1 in 27,000). The 26% unrestrained-among-fatalities figure corroborates that restraint status, not seat orientation, is the dominant observable determinant of which toddlers die.
- Independence
- NHTSA FARS is the underlying census for these occupant-fatality counts; the same census also feeds other government child-passenger summaries, so treat any of those as the same surveillance stream rather than an independent measurement.
-
[2] Injury Epidemiology — Anderson, Doud, Hamann et al. (2019) — Restraint use and injury in forward and rear-facing infants and toddlers involved in a fatal motor vehicle crash on a US Roadway Verified
Restraint use and injury in forward and rear-facing infants and toddlers involved in a fatal motor vehicle crash on a US Roadway- Statistic
FARS 2008-2015, 4,966 rear-seated infants/toddlers under 2; mortality 40.0% unrestrained vs 13.7% restrained (p<0.0001); restraint direction unrecorded in 63.3% of restrained records- Excerpt
“"Mortality was nearly triple in unrestrained passengers compared to restrained passengers (40.0% vs 13.7%, p < 0.0001). [...] Rear-facing restraint use increased from 5.0% to 23.2% between 2008 and 2015 (P < 0.0001). [...] More than half (63.3%) of the records for 4242 restrained children did not specify whether they were in a forward-facing or rear-facing restraint system." ”
- Source data from
- 2019-07-01
- Accessed
- 2026-07-07 · archived copy
- Verification
- Excerpt independently re-fetched and confirmed word-for-word against the cited source during our grounding audit.
- Calculation
- Source for the restraint personal-factor multiplier: 40.0% mortality unrestrained / 13.7% restrained ≈ 2.9x. Also the empirical basis for the caveat that US field crash data cannot resolve a rear-vs-forward mortality ratio — direction of restraint is not recorded in 63.3% of the restrained cases, so any precise orientation multiplier from US field data is unsupported.
- Independence
- Uses FARS, the same census underlying the NHTSA occupant counts, but answers a different question (restraint status and direction among fatal crashes) with its own coding, so it functions as a complementary analytic stream rather than a duplicate count.
-
[3] Center for Injury Research and Prevention, Children's Hospital of Philadelphia (CHOP) — New Evidence Supports Children Under 2 are Safest Riding Rear-Facing Verified
New Evidence Supports Children Under 2 are Safest Riding Rear-Facing- Statistic
The 2017 updated assessment (McMurry, Bull, Arbogast) found rear-facing children had a lower injury rate than forward-facing but could not reach statistical significance; 'we cannot associate a specific number or figure to that safety benefit'- Excerpt
“"While these data suggest that children are indeed safer riding rear-facing and align with other research in this area, we cannot associate a specific number or figure to that safety benefit. [...] The best practice recommendation from the AAP remains that children should ride in RFCRS until at least age 2 or they have outgrown the height or weight limits for their RFCRS." ”
- Source data from
- 2017-12-01
- Accessed
- 2026-07-07 · archived copy
- Verification
- Excerpt independently re-fetched and confirmed word-for-word against the cited source during our grounding audit.
- Calculation
- Not used in the arithmetic. This is the source for the entry's central honesty point: the "five times safer" figure comes from Henary et al. (Injury Prevention 2007), which was formally retracted (PubMed retraction record 29374082) and replaced by this group's 2017 updated assessment (Injury Prevention, doi 10.1136/injuryprev-2017-042512). The reanalysis found rear-facing directionally safer but statistically non-significant in the available NASS-CDS field data, which is why no orientation multiplier is assigned.
- Independence
- CHOP CIRP is the research center that authored both the retracted 2007 study and the 2017 reanalysis; this writeup summarizes the peer-reviewed reanalysis (Injury Prevention 2017) whose full text sits behind a paywall. Cited as the accessible authoritative summary of that paper.
-
[4] American Academy of Family Physicians (AAFP), summarizing AAP Pediatrics 2018 policy — AAP Updates Car Safety Seat Recommendations for Children Verified
AAP Updates Car Safety Seat Recommendations for Children- Statistic
AAP 2018 policy: rear-facing 'as long as possible' (age-2 milestone dropped); a correctly installed and used safety seat can reduce risk of death by as much as 71%; ~80% of car seats are used or installed incorrectly- Excerpt
“"All infants and toddlers should ride in a rear-facing car safety seat as long as possible, until they reach the highest weight or height allowed by the seat's manufacturer. [...] a correctly installed and used safety seat can reduce the risk of death in infants and toddlers by as much as 71 percent. [...] about 80 percent of all car safety seats are actually used or installed incorrectly." ”
- Source data from
- 2018-09-21
- Accessed
- 2026-07-07 · archived copy
- Verification
- Excerpt independently re-fetched and confirmed word-for-word against the cited source during our grounding audit.
- Calculation
- Source for the surviving recommendation (rear-facing as long as possible), the restraint-effectiveness magnitude (up to 71% death reduction for a correctly used seat versus none), and the ~80%-of-seats-misused figure. The 71% is a restraint-versus-no-restraint figure, not a rear-versus-forward figure — it corroborates that the large, measurable protection is in using and installing a seat correctly, not in the orientation milestone. Summarizes AAP policy statement Pediatrics 2018;142(5):e20182460.
- Independence
- AAFP is relaying the AAP Pediatrics 2018 policy statement; treat as the pediatric-policy citation, independent of the FARS/NHTSA crash census but not itself a primary field measurement.