Evidence quality 4.63/5
Eight-dimension review score against the quality rubric . Each dimension scored 1–5.
- D1 Source grounding
- 4/5
- D2 Source authority
- 5/5
- D3 Arithmetic
- 5/5
- D4 Uncertainty
- 5/5
- D5 Scope
- 5/5
- D6 Prose
- 4/5
- D7 Perception honesty
- 4/5
- D8 Caveat completeness
- 5/5
● your factors — click this risk ▾ to reveal
- Your factors
≈ As likely as
Perceived
Crash risk perception runs on the death frame. Fear surveys ask about dying in a crash or being hit by a drunk driver; nobody surveys dread of a fractured wrist on a commute. Meanwhile the optimism-bias literature is consistent that drivers rate themselves safer than average and their own crash odds below the population's, so the injury number — which is sixty times the death number — sits in a blind spot: too mundane to fear, too large to guess. People who have already been in a fender-bender tend to file it as bad luck rather than as the base rate showing up.
Rough estimate: most drivers would put their lifetime odds of a crash injury well below the measured ~1 in 3
Source: editorial intuition, not polled
Actual
~2.44 million people injured in police-reported traffic crashes per year (US, 2023)
US resident population, all ages
Show derivation
NHTSA's Summary of Motor Vehicle Traffic Crashes reports an estimated 2,442,581 people injured in police-reported traffic crashes in 2023. Because this entry is normalized to a US-adult lifetime, the child share is removed on both sides: NHTSA's Children fact sheet counts 161,478 injured children 14 and younger, leaving 2,442,581 − 161,478 = 2,281,103 injured people 15 and older, against a 15-and-older population of 334,914,895 − 59,498,481 = 275,416,414 (Census July 1, 2023). That gives an annual rate of 2,281,103 / 275,416,414 ≈ 0.828% per year, about 1 in 121. Compounding over the site's standard 59 remaining adult years: 1 − (1 − 0.00828)^59 ≈ 0.388, about 1 in 2.6. (Using the raw all-ages rate of 0.729%/yr instead gives 0.351 — 1 in 2.9 — the bottom of the plausible range; including 15-17-year-olds in the "adult" side slightly overstates the 18+ rate, since teens carry elevated crash rates.) Two opposing biases bracket the estimate: the same person can be injured more than once (repeat victims make the distinct-person lifetime probability lower than naive compounding), while police-reported counts miss injuries never reported to police (pushing the true figure higher). The uncertainty band spans both.
Caveats: The headline counts police-reported injuries of any severity, from bruises and w…
The headline counts police-reported injuries of any severity, from bruises and whiplash through permanent disability — the severe tail is a small fraction of the 2.44 million. Injuries never reported to police (common for minor single-vehicle and low-speed crashes) are excluded entirely, so the true any-injury figure is higher than the police-reported estimate. Compounding an annual average over 59 years assumes independent years and an average exposure profile: people who do not drive or ride sit below the number, high-mileage drivers above it, and one person can be injured more than once, which makes the share of people ever injured somewhat lower than the naive compounding suggests. CRSS injury counts are sample-based estimates with sampling error NHTSA reports separately.
Related risks
Other risks on similar themes — for exploring related fears.







E-bike no helmet
What are the odds of serious head injury riding an e-bike without a helmet?

E-scooter no helmet
What are the odds of serious head injury riding an e-scooter without a helmet?
Pick challenger
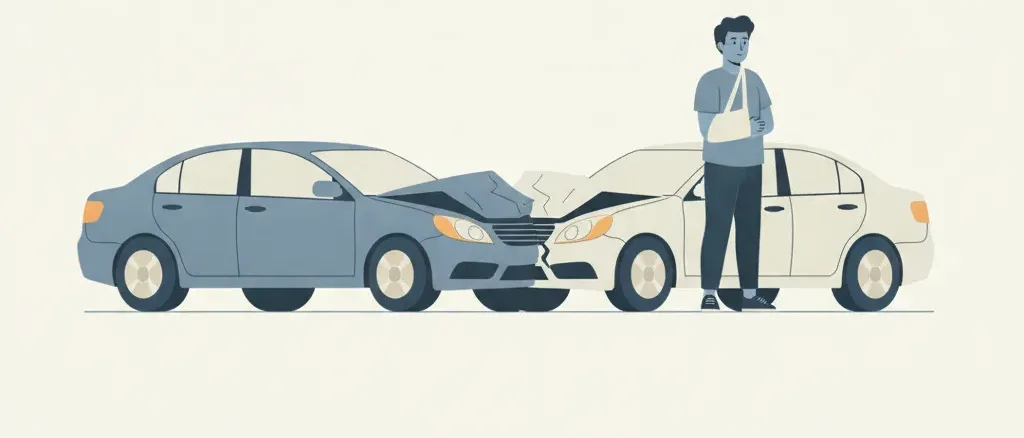
Death is the rare tail of a car crash; injury is the routine outcome. In 2023 the United States recorded an estimated 6,138,359 police-reported crashes. They killed 40,901 people and injured an estimated 2,442,581 — about 60 injured for every death, five people injured every minute. Spread over the Census Bureau’s 334.9 million residents, that is roughly a 1-in-137 chance of being one of the injured in any given year; removing the 161,478 injured children and the 59.5 million child population puts the adult rate at about 1 in 121 per year, and compounding that over 59 adult years lands at about 1 in 2.6. Put plainly: on current rates, a US adult has better-than-one-in- three odds of being injured in a traffic crash at some point, against the Car crash death odds of about 1 in 105.
The two companion numbers answer different questions and should not be blended. The death entry starts from a 12.2-per-100,000 annual fatality rate; this entry compounds an 828-per-100,000 annual adult injury rate, and the injury figure counts every person in the vehicle plus struck pedestrians and cyclists. A third construction, At-fault injury crash, asks who caused the injury crash and arrives — from an injury-crash count divided by licensed drivers — in the same neighborhood, about 1 in 2.9 lifetime. The similarity is not double counting: about one driver causes each injury crash, and each injury crash injures about 1.4 people, so the causing-odds and the being-injured odds end up at the same order of magnitude.
What moves the number is mostly familiar. Correctly used lap/shoulder belts cut moderate-to-critical injury risk in half for front-seat passenger-car occupants, which makes riding unbelted a doubling (Unbelted crash death covers the fatality side). Per mile driven, 16-19-year-old drivers crash fatally at three times the rate of drivers 20 and older, and a driver on four hours of sleep carries about 2.9 times the per-trip culpable-crash odds. The caveats cut both ways: police-reported counts miss injuries nobody files a report for, while repeat victims mean fewer distinct people are injured than naive compounding implies. The per-VMT injury rate has been flat at 75 per 100 million miles through 2022-2023, so nothing in the recent trend suggests the lifetime figure is about to move.
Related tidbits
US traffic crashes killed 40,901 people in 2023 and injured an estimated 2.44 million — about 60 injuries per death (NHTSA). Lifetime odds: ~1 in 105 of dying, ~1 in 2.6 of being injured; ~1 in 27 for a child riding through age 14.
Claim ledger
Every number below is what each source reported, with the verbatim quote we relied on and how we arrived at our figure. Click any link to verify directly.
-
[1] National Highway Traffic Safety Administration (NHTSA) — Summary of Motor Vehicle Traffic Crashes: 2023 Data (DOT HS 813 762)
Summary of Motor Vehicle Traffic Crashes: 2023 Data (DOT HS 813 762)- Statistic
2023: estimated 6,138,359 police-reported traffic crashes; 40,901 killed; estimated 2,442,581 people injured; 1,697,252 injury crashes (Table 1); injury rate 75 per 100 million VMT (unchanged from 2022)- Excerpt
“"In 2023 there were an estimated 6,138,359 police-reported traffic crashes in which 40,901 people were killed and an estimated 2,442,581 people were injured. [...] One person was killed every 13 minutes and an estimated 5 people injured every minute in traffic crashes in 2023. [...] the injury rate per 100 million VMT was 75 in 2022 and remained the same in 2023." ”
- Source data from
- 2025-10-01
- Accessed
- 2026-07-26 · archived copy
- Calculation
- The 2,442,581 persons-injured estimate is the numerator. It counts every injured person — drivers, passengers, pedestrians, and pedalcyclists — in police-reported crashes, estimated from NHTSA's Crash Report Sampling System (CRSS). This is the October 2025 revision of the 2023 file; the earlier release carried 2,442,694, which still appears in the at-fault-injury-crash-liability entry's ledger. Annual rate: 2,442,581 / 334,914,895 ≈ 0.00729.
- Independence
- CRSS is a probability sample of police crash reports, independent of insurance claims, hospital discharge data, and the FARS fatality census.
-
[2] U.S. Census Bureau — U.S. Population Trends Return to Pre-Pandemic Norms as More States Gain Population (Vintage 2023 estimates)
U.S. Population Trends Return to Pre-Pandemic Norms as More States Gain Population (Vintage 2023 estimates)- Statistic
US resident population 334,914,895 as of July 1, 2023- Excerpt
“"The nation gained more than 1.6 million people this past year, growing by 0.5% to 334,914,895." ”
- Source data from
- 2023-12-19
- Accessed
- 2026-07-26 · archived copy
- Calculation
- Denominator for the annual per-person injury rate. Using the full resident population (all ages) matches the numerator, which also counts injured people of all ages.
- Independence
- Census Bureau population estimates are produced from birth, death, and migration administrative records, wholly independent of NHTSA crash data.
-
[3] National Highway Traffic Safety Administration (NHTSA) — Traffic Safety Facts 2023 Data: Children (DOT HS 813 712)
Traffic Safety Facts 2023 Data: Children (DOT HS 813 712)See all 2 Likelier entries citing this source →
- Statistic
161,478 children (14 and younger) injured in traffic crashes in 2023; child population 59,498,481. Lap/shoulder belts, correctly used, reduce the risk of moderate-to-critical injury by 50% for front-seat passenger-car occupants 5 and older, and by 65% for light-truck occupants- Excerpt
“"An estimated 161,478 children were injured in traffic crashes in 2023, a 3-percent increase from 156,502 in 2022. [...] There were 59.5 million children in the United States, 18 percent of the total U.S. population. [...] Analysis has also shown that lap/shoulder seat belts, when used correctly, reduce the risk of fatal injury to front-seat occupants 5 and older of passenger cars by 45 percent and the risk of moderate-to-critical injury by 50 percent. For light-truck occupants, seat belts reduce the risk of fatal injury by 60 percent and the risk of moderate-to-critical injury by 65 percent." ”
- Source data from
- 2025-04-01
- Accessed
- 2026-07-26 · archived copy
- Calculation
- Two uses. (1) The 161,478 child-injury count (and the fact sheet's Table 7 child population of 59,498,481) is subtracted from the all-ages numerator and denominator to produce the adult-scoped annual rate in the normalized block. (2) Basis for the unbelted-occupant multiplier: a 50% reduction in moderate-to-critical injury for belted passenger-car occupants implies an unbelted occupant faces roughly 2.0× the injury risk per crash (1 / 0.50), rising toward ~2.9× in light trucks (1 / 0.35). NHTSA's fact sheet attributes the effectiveness estimate to Kahane (2000), DOT HS 809 199.
- Independence
- Restraint-effectiveness estimates derive from FARS double-pair comparison analyses, a different method and dataset than the CRSS injury-count estimate used for the headline number.
-
[4] Insurance Institute for Highway Safety (IIHS) — Fatality Facts 2022: Teenagers
Fatality Facts 2022: TeenagersSee all 2 Likelier entries citing this source →
- Statistic
Per mile driven, the fatal crash rate for drivers 16-19 is just over 3 times the rate for drivers 20 and older (2022 data)- Excerpt
“"The fatal crash rate per miles driven for 16-19 year-olds is just over 3 times the rate for drivers ages 20 and over." ”
- Source data from
- 2024-05-01
- Accessed
- 2026-07-26 · archived copy
- Calculation
- Basis for the teen-driver multiplier. The 3× figure is a fatal-crash involvement rate per mile driven; police-reported all-severity crash rates for 16-19-year-olds show a similar or larger per-mile elevation, so 3× is used as a conservative injury-risk proxy and labeled with its fatal-crash basis.
- Independence
- IIHS computes rates from FARS fatality counts and FHWA/NHTSA travel survey mileage, independent of the CRSS injury estimates.
-
[5] Tefft, B.C. — Sleep (Oxford Academic) — Acute sleep deprivation and culpable motor vehicle crash involvement
Acute sleep deprivation and culpable motor vehicle crash involvementSee all 2 Likelier entries citing this source →
- Statistic
Compared with drivers who slept 7-9 hours in the 24 hours before crashing, adjusted odds of culpable crash involvement were 1.3× for 6 hours of sleep, 1.9× for 5 hours, 2.9× (95% CI 1.4-6.2) for 4 hours, and 15.1× (95% CI 4.2-54.4) for less than 4 hours.- Excerpt
“"Drivers who reported having slept for 6, 5, 4, and less than 4 hr in the 24 hr before crashing had 1.3 (95% confidence interval [CI] = 1.04 to 1.7), 1.9 (1.1 to 3.2), 2.9 (1.4 to 6.2), and 15.1 (4.2 to 54.4) times the odds, respectively, of having been culpable for their crashes, compared with drivers who reported 7–9 hr of sleep." ”
- Source data from
- 2018-09-01
- Accessed
- 2026-07-26 · archived copy
- Calculation
- Basis for the sleep-deprivation multiplier (2.9× at 4 hours of sleep, per-trip culpable-crash odds; 5 hours is 1.9×, below 4 hours 15.1×). Case-control analysis drawn from the NHTSA National Motor Vehicle Crash Causation Survey: 6,845 drivers in a representative sample of crashes investigated in 2005-2007.
- Independence
- Peer-reviewed AAA Foundation analysis of NMVCCS data — a different crash sample than CRSS and FARS.