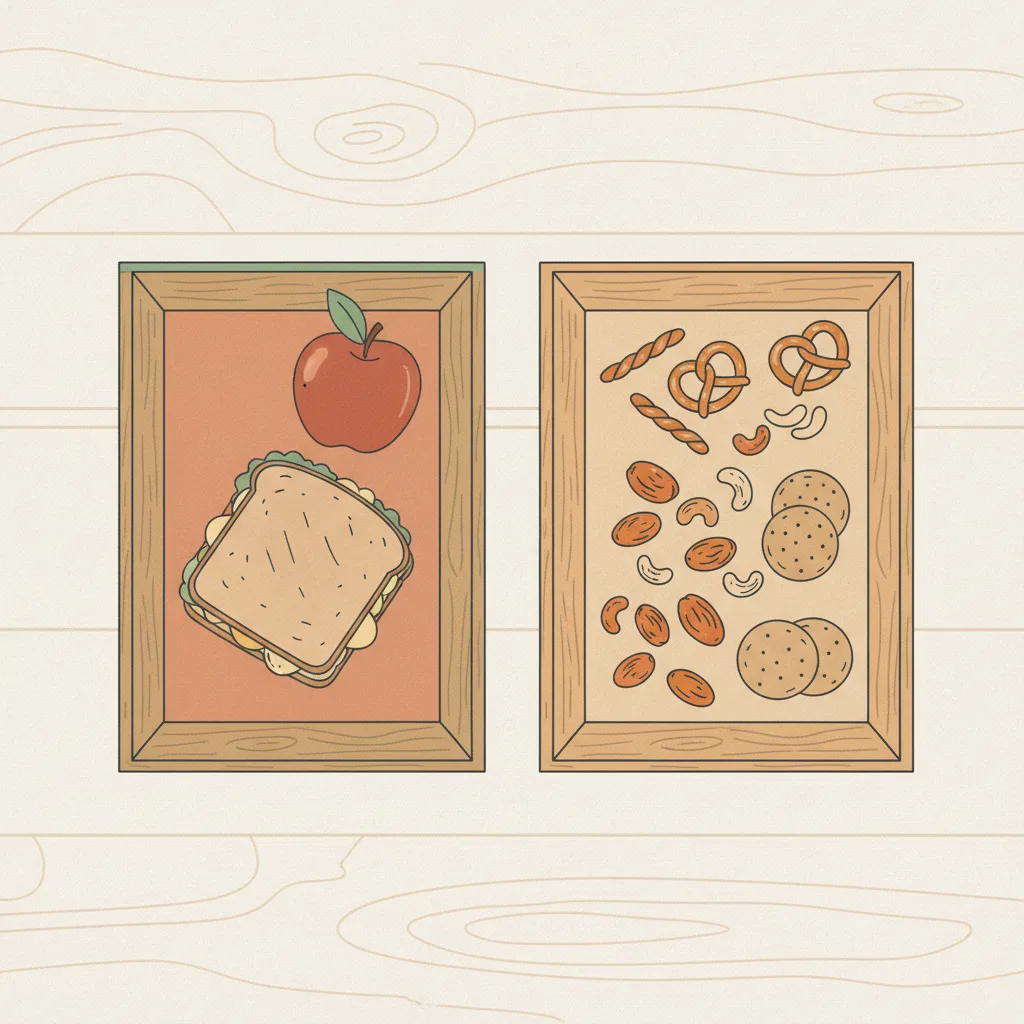
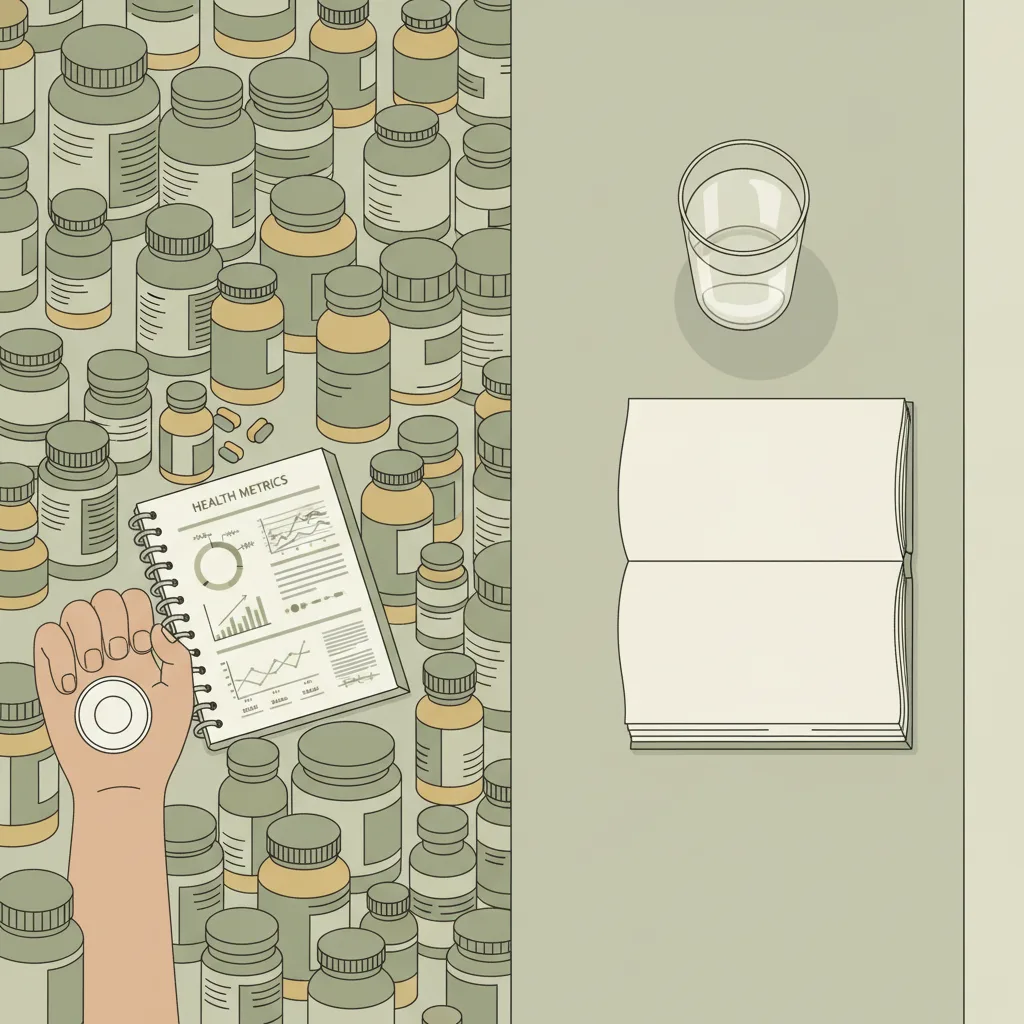
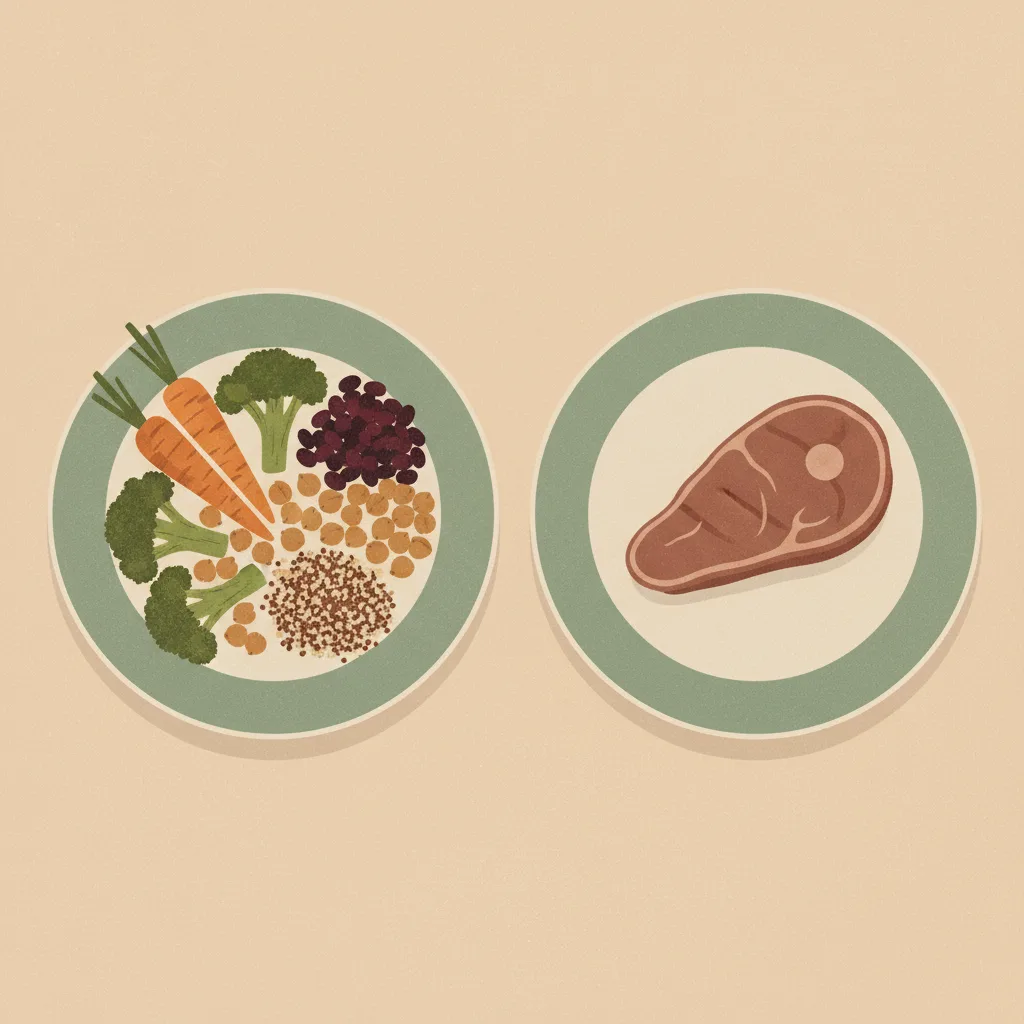
Comer snacks entre comidas (patrón moderno de pastoreo) vs. comer solo en 2-3 comidas definidas sin snacks
Si actúas
Comer snacks entre comidas
15%
Si no actúas
Comer solo en 2-3 comidas definidas (sin snacks)
27%
Porcentaje de quienes luego se arrepienten de cada elección. Las barras y el registro completo aparecen abajo.
Estilo de vida
Última revisión 2026-05-30
Calidad de la evidencia 3.75/5
Puntuación de revisión en ocho dimensiones según la
rúbrica de calidad
. Cada dimensión puntuada de 1 a 5.
D1 Verificación de fuentes
4/5
D2 Autoridad e independencia de las fuentes
5/5
D3 Precisión de la tasa de arrepentimiento
2/5
D4 Comparabilidad de las fuentes
4/5
D5 Patrón de Gilovich
3/5
D6 Calidad de la prosa
4/5
D7 Completitud de las advertencias
3/5
D8 Calidad de la muestra
5/5
Media3.75/5
Datos sustitutos — no existe ninguna encuesta directa sobre el arrepentimiento para esta decisión. Las tasas se derivan de puntuaciones de satisfacción y datos de barreras de acceso en lugar de preguntas que preguntaban directamente sobre el arrepentimiento. Ver advertencias más abajo.
Arrepentimiento por acción
Comer snacks entre comidas
15%
~15% de los adultos de EE. UU. se fija un propósito de Año Nuevo dirigido a reducir los tentempiés/alimentos azucarados (la porción específica de tentempiés de la cifra del 25% de cualquier propósito relacionado con la comida de Purdue — intención prospectiva declarada, no arrepentimiento retrospectivo)
El 27% de los adultos de EE. UU. trabaja activamente para perder peso (proxy de intención de control de peso — no un arrepentimiento directo sobre el patrón de solo comidas)
Twenty-seven percent of US adults are actively working to lose
weight, per Gallup’s November 2024 national poll of 1,001 adults
— the closest available proxy for dissatisfaction with eating patterns
that might motivate adopting a meals-only structure. That figure is
the inaction-side proxy shown above. It falls short of a direct regret
measure: the meals-only pattern is the minority position in the US,
so the question “do you regret not snacking?” is structurally rare,
and most adults who restrict to defined meals do so deliberately as
a weight-management or blood-sugar strategy rather than as a
regret-driven reversal of a prior snacking habit.
On the other side, 25% of US consumers set a food or nutrition-
related New Year’s resolution in 2024, per Purdue’s Consumer Food
Insights survey of 1,200 US adults — up six percentage points from
2023, with “the majority” planning to limit salty snacks, sugary
foods, regular soft drinks and alcohol. That 25% spans many dietary
goals, not snacking, so the action-side proxy is the snacking-specific
slice: roughly 13-18% of all US adults if “the majority” means about
half to two-thirds of those with resolutions, which we set at ~15%.
Even that ~15% is prospective intent to cut snacks, not retrospective
regret about a snacking habit. The structural
backdrop: USDA NHANES 2017-March 2020 data show 95% of US adults
snack on a given day, 78% snack multiple times, and among consumers
snacks contribute 24% of daily energy and 43% of added sugars. The
two figures come from different instruments (Purdue resolution
intent vs Gallup active weight-management) and measure different
constructs (prospective resolution vs current effort), so any
cross-side comparison is approximate.
The meal-frequency question is genuinely contested in the nutrition
literature. Bellisle’s 2014 Physiology & Behavior review concludes
that snacking neither clearly causes obesity nor clearly prevents
it, that eating frequency does not independently predict body weight
when total energy intake is controlled, and that the same eating
pattern can have different effects depending on food quality and
context. That weakens the case for either side carrying strong
regret: most US adults snack, most US adults who snack are not
measurably worse off for it when energy intake is matched, and the
few who reverse to a meals-only pattern do not have unambiguous
evidence that their previous behavior caused them measurable harm.
The ~12-point gap between the ~15% snacking-resolution share and the
27% active weight-management share is a difference between two weak,
non-comparable proxy instruments, not a measured difference in
regret. Readers should treat both figures as proxies for different
constructs and not read the delta as a precise regret comparison.
Fuentes: acción
Registro de evidencia
Cada número a continuación es lo que reportó cada fuente, con la cita textual en la que nos basamos y cómo llegamos a nuestra cifra. Haz clic en cualquier enlace para verificarlo directamente.
1/3 fuentes verificadas de forma independiente palabra por palabra frente a la fuente citada
[1]News-Medical / coverage of Purdue Consumer Food Insights Jan 2024 — Increasing New Year's resolutions for healthier eating, Purdue report finds
Fuente de referencia
25% of US consumers had a food/nutrition-related New Year's resolution in 2024 (up 6 pp from 2023); the majority plan to increase fruits, vegetables and water while limiting salty snacks, sugary foods, regular soft drinks and alcohol; 46% anticipate cravings as an obstacle
Extracto
“"25% of consumers responded 'yes' when asked if they had any food or nutrition-related New Year's resolutions, up 6 percentage points from the response to the same question last year... the survey-based report out of Purdue University's Center for Food Demand Analysis and Sustainability...included 1,200 consumers across the U.S."
”
Datos de la fuente de
2024-02-15
Accedido
2026-05-30
Cálculo
Purdue Center for Food Demand Analysis and Sustainability, Consumer Food Insights, Volume 3 Issue 1, January 2024, N=1,200 US consumers. The 25% headline is the share of US consumers with ANY food/nutrition-related New Year's resolution, covering many dietary goals (more fruit/veg/water, less salty snacks, sugary foods, soft drinks, alcohol) — it is NOT a snacking-specific figure and NOT a regret measure. Because the report says \"the majority\" of those resolutions target the salty-snacks/sugary-foods/soft-drinks/alcohol basket (not snacking alone), the snacking-targeted share is roughly 0.25 x ~50-70% = 13-18% of all US adults. We therefore set the action-side proxy to the midpoint, ~15% (regret_rate 0.15), and label it explicitly as prospective resolution intent to cut snacks/sugary foods, not retrospective regret about snacking. The earlier 25% figure fused the all-resolutions headline with a snacking claim and overstated the snacking-targeted signal; this has been corrected.
Independencia
Independent academic survey from Purdue's Center for Food Demand Analysis and Sustainability with publicly disclosed methodology; no commercial sponsorship of the consumer insights series.
[2]USDA Agricultural Research Service / Sebastian, Hoy, Goldman, Moshfegh — Snack Consumption by U.S. Adults: What We Eat in America, NHANES 2017 - March 2020
Informe gubernamental
95% of US adults aged 20+ consume one or more foods or beverages as a snack on the intake day; 78% consume two or more snacks; snacks provide on average 24% of daily energy and 43% of added sugars among consumers
Extracto
“"Among adults aged 20 years and older, 95% consume one or more foods and/or beverages at a snack on the intake day... Currently, consuming multiple snacks is the norm, with 78% consuming two or more on any given day. Among consumers, snacks provide on average 24% of daily intake of energy and 43% of added sugars."
”
Datos de la fuente de
2024-04-01
Accedido
2026-05-30
Cálculo
USDA Dietary Data Brief No. 53, based on NHANES 2017-March 2020 nationally representative dietary recall data. Establishes the prevalence baseline: 95% of US adults snack at least once on a given day; 78% snack multiple times; snacks contribute 24% of daily energy and 43% of added sugars on average. Used here on the action side as the govt_report context: snacking is the normal modern US eating pattern, not a deviation. This is NOT the regret-rate figure; that is from Purdue Jan 2024 (see above). The NHANES data establishes that the question \"do you regret snacking?\" applies to nearly all US adults if at all, and that the dietary stakes (43% of added sugars from snacks among consumers) are concrete.
Independencia
US federal government data (NHANES via USDA ARS) with publicly disclosed methodology; no commercial sponsorship of the survey or analysis. Independent of the Purdue insights series.
[3]Journal of Nutrition / Piernas & Popkin — Snacking Increased among U.S. Adults between 1977 and 2006
Verificado
Revisado por pares
US adult snacking prevalence increased from 71% to 97% between 1977-78 and 2003-06; contribution of snacks to total energy intake increased from 18% to 24%
Extracto
“"snacking prevalence increased significantly from 71 to 97% in 2003-2006... the percentage of snacking on both d 1 and d 2 increased from 42 to 78%... the contribution of snacks to total energy intake increased from 18 to 24%."
”
Datos de la fuente de
2010-02-01
Accedido
2026-05-30
Verificación
Extracto recuperado de forma independiente y confirmado palabra por palabra frente a la fuente citada durante nuestra auditoría de fundamentación.
Cálculo
Piernas & Popkin (J Nutr 2010) established the long-run shift: US adult snacking went from a minority behavior (71% on any given day in 1977-78) to near-universal (97% by 2003-06), with the share of daily energy from snacks rising from 18% to 24%. Used on the action side as the peer-reviewed historical baseline for the prevalence claim above. This is NOT the action-side regret-rate figure; that is the snacking-specific share (~15%) derived from Purdue's January 2024 resolution survey (see above). Snacking-related regret has not been directly surveyed in the US, so the action side relies on a prospective resolution-intent proxy, not a retrospective regret measure.
Independencia
Independent academic analysis of CDC NHANES data; methodology publicly disclosed. No commercial sponsorship of the analysis.
Fuentes: inacción
Registro de evidencia
Cada número a continuación es lo que reportó cada fuente, con la cita textual en la que nos basamos y cómo llegamos a nuestra cifra. Haz clic en cualquier enlace para verificarlo directamente.
2/2 fuentes verificadas de forma independiente palabra por palabra frente a la fuente citada
[1]Gallup News — 43% of Americans Say They Are Overweight; 55% Want to Slim Down
Verificado
↗ 1 other entry
Fuente de referencia
27% of US adults are actively working to lose weight; 55% want to lose weight; 43% view themselves as overweight
Extracto
“"43%, view themselves as overweight... 55%, say they want to lose weight... only 27% report they are actively working toward that goal."
”
Datos de la fuente de
2024-12-10
Accedido
2026-05-30
Verificación
Extracto recuperado de forma independiente y confirmado palabra por palabra frente a la fuente citada durante nuestra auditoría de fundamentación.
Cálculo
Gallup national poll, N=1,001 US adults, fielded November 6-20, 2024, margin of error ±4 percentage points. Used here as the inaction-side proxy: 27% of US adults are actively pursuing weight management, a state that implies current dissatisfaction with some aspect of current eating behavior including the absence of structural snacking discipline. This is NOT a direct regret measure about the meals-only pattern; in fact, the meals-only pattern is the minority position (95% of US adults snack daily per NHANES), so the question \"do you regret not snacking?\" is structurally rare. The 27% captures the directional signal: a substantial minority of US adults are actively dissatisfied enough with their current diet to do something about it, and \"cut the snacks\" is one of the most common dietary-change targets in popular guidance.
Independencia
Independent Gallup national poll using random-digit-dial methodology; no shared sample with USDA NHANES or Piernas & Popkin. Different methodology and different construct.
[2]Physiology & Behavior / France Bellisle — Meals and snacking, diet quality and energy balance
Verificado
Revisado por pares
Snacking may contribute to excess energy intake and weight gain via context, frequency and food quality; in some reports snacking facilitates energy-intake adjustment to needs, in others (especially obese populations) it contributes energy but little nutrition
Extracto
“"Snacking may contribute to excess energy intake and weight gain through different ways, for example: context/environment of eating, frequency of consumption and quality of food choices. In many reports, snacking appears to facilitate the adjustment of energy intake to needs, and to contribute carbohydrates, rather than fats, to the diet. By contrast, snacking often appears to contribute much energy but little nutrition in the diet of other consumers, particularly obese children and adults."
”
Datos de la fuente de
2014-07-01
Accedido
2026-05-30
Verificación
Extracto recuperado de forma independiente y confirmado palabra por palabra frente a la fuente citada durante nuestra auditoría de fundamentación.
Cálculo
Bellisle (Physiology & Behavior 2014) is the canonical peer- reviewed review framing the meal-frequency literature. The critical finding: eating frequency does not independently predict body weight when total energy intake is controlled. Used here on the inaction side as the literature basis for the observation that the case for a meals-only pattern is genuinely contested — snacking neither clearly causes obesity nor clearly prevents it, and the same eating pattern can have different effects depending on food quality and context. This is NOT the regret rate; that is from Gallup 2024. Bellisle's review provides the scientific context that weakens the case for the inaction side carrying strong regret: most US adults snack, most US adults who snack are not measurably worse off for it when energy intake is matched, and the few who reverse to a meals-only pattern do not have unambiguous evidence that their previous behavior was harmful.
Independencia
Independent peer-reviewed academic review with publicly disclosed methodology; Bellisle has published widely on eating frequency, including some industry-funded studies on snacking listed in her overall body of work but the 2014 P&B review is not directly industry-sponsored.
Advertencias
Ninguno de los dos lados mide el arrepentimiento de forma directa, y ninguna encuesta publicada en EE. UU. pregunta de frente «¿te arrepientes de picar entre comidas?» o «¿te arrepientes de no picar?». La cuestión de la frecuencia de las comidas está genuinamente en disputa en la literatura de nutrición (Bellisle 2014, Physiol Behav): la frecuencia de la ingesta no predice de forma independiente el peso corporal cuando se controla la ingesta energética total. La encuesta Consumer Food Insights de Purdue de enero de 2024 halló que el 25% de los consumidores de EE. UU. tiene ALGÚN propósito de Año Nuevo relacionado con la comida o la nutrición; ese 25% abarca muchos objetivos dietéticos, no solo los tentempiés. Dado que «la mayoría» de esos propósitos apuntan al conjunto de tentempiés salados/alimentos azucarados/refrescos/alcohol, la porción específica de tentempiés es aproximadamente del 13-18% de todos los adultos de EE. UU., por lo que fijamos el proxy del lado de la acción en el punto medio, ~15%. (Una versión anterior usaba el 25% completo, que fusionaba el titular de todos los propósitos con una afirmación sobre los tentempiés y sobrestimaba la señal de acción). Incluso al 15%, esto es una intención prospectiva de un propósito, no un arrepentimiento retrospectivo sobre los tentempiés. El 27% del lado de la inacción es la proporción de Gallup de noviembre de 2024 de adultos de EE. UU. que trabaja activamente para perder peso — una señal relacionada pero indirecta, y el patrón de solo comidas es en sí mismo la posición minoritaria en EE. UU. (el 95% de los adultos de EE. UU. pica a diario según USDA NHANES 2017-marzo 2020), por lo que la pregunta «¿te arrepientes de no picar?» es estructuralmente rara. Usamos la cifra del 27% de esfuerzo activo por perder peso como el proxy adyacente al arrepentimiento disponible más cercano. Las dos cifras provienen de instrumentos y poblaciones distintos (la encuesta de intención de propósitos de Purdue frente al sondeo de control activo de peso de Gallup) y miden constructos distintos (propósito prospectivo frente a esfuerzo actual), por lo que cualquier comparación entre los lados es aproximada y no debe leerse como una brecha de arrepentimiento precisa. El regret_delta de ~12 puntos refleja dos instrumentos proxy no comparables, no una diferencia medida en el arrepentimiento. Bajo la cuestión del arrepentimiento subyace la causalidad en disputa: los datos de NHANES muestran que los tentempiés aportan el 24% de la energía diaria y el 43% de los azúcares añadidos entre los consumidores, lo que establece el patrón de tentempiés como un contribuyente importante a la ingesta de calorías pobres en nutrientes, pero la revisión de Bellisle sostiene que la dimensión de la frecuencia de las comidas está en gran medida subordinada a la ingesta energética total y a la calidad de los alimentos.