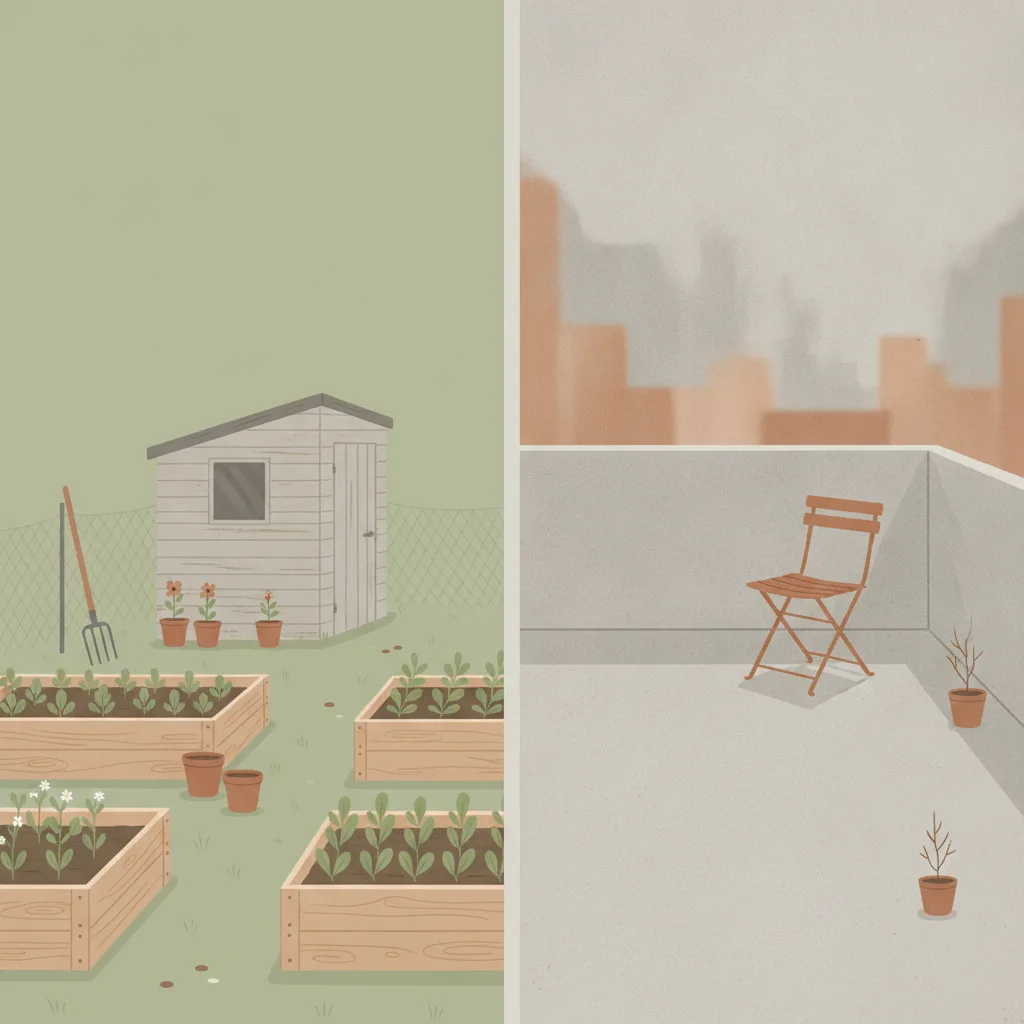
Conseguir un huerto urbano o una parcela de huerto comunitario vs. quedarse sin ella
Si actúas
Conseguir un huerto urbano o comunitario
8,0%
Si no actúas
Quedarse sin huerto ni parcela
38%
Al menos una cifra es una estimación indirecta, no una tasa de arrepentimiento medida. Abajo se explica cómo se obtuvo cada cifra.
Estilo de vida
Última revisión 2026-05-04
Calidad de la evidencia 4.13/5
Puntuación de revisión en ocho dimensiones según la
rúbrica de calidad
. Cada dimensión puntuada de 1 a 5.
D1 Verificación de fuentes
5/5
D2 Autoridad e independencia de las fuentes
4/5
D3 Precisión de la tasa de arrepentimiento
2/5
D4 Comparabilidad de las fuentes
3/5
D5 Patrón de Gilovich
5/5
D6 Calidad de la prosa
5/5
D7 Completitud de las advertencias
5/5
D8 Calidad de la muestra
4/5
Media4.13/5
Datos indirectos: para esta decisión, al menos una cifra procede de una medida indirecta, como resultados, satisfacción o intención, o de una estimación editorial, y no de una encuesta directa sobre el arrepentimiento. Las notas de cada lado, más abajo, explican cómo se obtuvo su cifra.
Si actúas
Conseguir un huerto urbano o comunitario
8,0%
El 91,9% de los titulares de huertos comunitarios valoran el beneficio de su parcela para la salud mental con 8/10 o más (proxy de satisfacción — no existe ninguna encuesta directa de arrepentimiento ni de abandono de la parcela; el ~8% mostrado es la proporción que no da la máxima valoración, NO una tasa de arrepentimiento medida)
Titulares de huertos en Reino Unido
encuesta retrospectiva, 2025
Si no actúas
Quedarse sin huerto ni parcela
38%
El ~38% de los no hortelanos citan la falta de acceso como el motivo por el que no cultivan
Adultos del Reino Unido que no han jardineado en los últimos 12 meses
encuesta transversal, 2025
Cifra de cada elección (la medida se indica en la página)
Conseguir un huerto urbano o comunitarioQuedarse sin huerto ni parcela
8,0%38%
Decisiones relacionadas
Decisiones semánticamente similares — mismo terreno, distintos compromisos.
Approximately 91.9% of UK allotment plot holders rate the mental health benefit
of their plot at 8 or higher out of 10, with 63% giving a perfect 10, according to
the National Allotment Society’s 2025 survey of approximately 2,000 holders. A 2010
peer-reviewed study in Environmental Health (van den Berg et al.) reached the same
figure independently: 91% of Dutch allotment gardeners reported increased happiness
after visiting their plot, and their life satisfaction scores were significantly
higher than those of matched non-gardening neighbors drawn from the same residential
areas (2.26 vs 2.12, p<0.05). Neither survey asked holders whether they regret
their plot; both measured benefit ratings, and in both the residual 8–9% is simply
the share who did not give the top positive response rather than a count of people
who wished they had not taken a plot. No published study reports a direct allotment
regret or relinquishment-due-to-regret rate, so the figure shown here is a
satisfaction-tail proxy, not a measured regret rate. The pattern
holds across age groups but is sharpest in older adults: among those over 62, the
Dutch gardeners scored 0.32 on a composite wellbeing index versus −0.26 for same-age
neighbors, and loneliness scores diverged by a factor of nearly three.
The inaction side is structured by access rather than preference. The RHS State of
Gardening 2025 found that 38% of UK adults who had not gardened in the past year
cited lack of access to growing space as the reason — the largest single barrier,
and one that implies desire without opportunity rather than chosen non-participation.
In the same RHS survey, 14.7 million adults said they would be interested in
volunteering for organised community gardening sessions, while 2.5 million had
taken part in community gardening initiatives over the past three years. Over
174,000 people are on UK waiting lists for allotment plots at any given time, with
average waits of four years nationally and up to twelve years in some London boroughs.
This is unusual among decisions studied here: the inaction group is partly
involuntary, shaped by land supply and local authority policy rather than freely
chosen preference. Whether one frames that constraint as regret or frustration, it
is directionally the same: a large population wants the outcome and does not have it.
The Gilovich inaction-dominance pattern is among the more robust in this dataset for
this topic, though both sides rest on proxies rather than direct regret questions.
The roughly 30-percentage-point gap between the action-side satisfaction-tail proxy
(~8% non-top rating) and the inaction-side access-barrier proxy (~38% cite lack of
access) is consistent across UK survey data and the Dutch controlled study, and
it is consistent with findings in adjacent decisions like gym membership and therapy
— categories where the barrier to starting tends to feel large and the regret after
starting tends to be low. The specific mechanism is well-documented: allotment
holders visit regularly (unlike vacation cabin owners), the costs are low relative to
perceived benefit, and the social dimension of a shared site appears to add value
that solo garden ownership does not. For those fortunate enough to reach the front
of a waiting list, the decision to take the plot is almost universally reported as
the right one.
Fuentes: acción
Registro de evidencia
Cada número a continuación es lo que reportó cada fuente, con la cita textual en la que nos basamos y cómo llegamos a nuestra cifra. Haz clic en cualquier enlace para verificarlo directamente.
2/2 fuentes verificadas de forma independiente palabra por palabra frente a la fuente citada
[1]National Allotment Society (via Pressat press office) — Growing the Evidence: Survey Shows the Power of Allotments
Verificado
Fuente de referencia
91.9% of UK allotment holders rate mental health benefits at 8/10 or higher; 63% give a perfect 10/10
Extracto
“"Nearly 63% of respondents rated the impact of their allotment on mental wellbeing a perfect 10, with 91.9% scoring it 8 or higher. Physical health benefits were similarly high, with 88.1% rating them 8 or above. 89.2% increased their fresh produce intake after getting a plot. 80.3% credited their plot with forming new social relationships."
”
Datos de la fuente de
2025-08-11
Accedido
2026-05-04
Verificación
Extracto recuperado de forma independiente y confirmado palabra por palabra frente a la fuente citada durante nuestra auditoría de fundamentación.
Cálculo
NAS 2025 survey of approximately 2,000 UK allotment plot holders. The survey measured benefit ratings, not regret: 91.9% rated the plot's mental-health benefit 8/10 or higher. The 8% stored as regret_rate is the arithmetic complement of that 91.9% (those who did NOT give a top-band rating), i.e. the satisfaction-score tail — NOT a dissatisfaction or regret rate. No question asked "do you regret getting an allotment", and no published survey measures allotment regret or relinquishment-due-to-regret (the 2024 Birmingham study of 876 tenants, Bloomfield, reports tenure — 9% held a plot <1 year, 36% 1–5 years — but no regret/quit rate; the 2025 APSE Local Authority State of the Market survey reports waiting-list demand, not plot abandonment). The non-top rating share is used only as the closest available proxy, with that limitation stated explicitly in the display and caveats. It is in the same range as the Netherlands peer-reviewed study (van den Berg et al. 2010), where 91% of allotment gardeners reported increased happiness after plot visits — again a positive-rating figure, not a measure of regret. The residual 8–9% in both samples is the share who did not give the top positive response, not a count of people who wished they had not taken a plot.
Independencia
NAS is an independent UK charity that represents allotment holders. This survey is independent of the RHS, van den Berg academic study, and any commercial or government source.
[2]Environmental Health (BioMed Central / Springer) — Allotment gardening and health: a comparative survey among allotment gardeners and their neighbors without an allotment
Verificado
Revisado por pares
91% of allotment gardeners reported increased happiness after plot visits; life satisfaction 2.26 vs 2.12 for non-gardening neighbors (p<0.05)
Extracto
“"Eighty-four percent reported feeling healthier after a visit to the allotment garden. [...] 91 percent reported feeling happier and 86 percent reported feeling less stressed."
”
Datos de la fuente de
2010-10-27
Accedido
2026-05-04
Verificación
Extracto recuperado de forma independiente y confirmado palabra por palabra frente a la fuente citada durante nuestra auditoría de fundamentación.
Cálculo
van den Berg et al. (2010) surveyed 121 allotment gardeners and 63 matched non-allotment neighbors recruited from the same residential areas near 12 allotment sites in 8 Dutch cities (July–September sampling). Both groups completed the same wellbeing questionnaire, providing a genuine comparison of people who garden vs. comparable people who do not. The 91% happiness increase rate among gardeners implies approximately 9% who did not report this outcome — consistent with the NAS 2025 UK figure. Used here as the independent peer-reviewed anchor corroborating the NAS satisfaction finding.
Independencia
Independent of all other sources: peer-reviewed academic study published in a Springer/BioMed Central journal, conducted by Dutch university researchers (Wageningen UR), using a controlled matched-sample design rather than a self-selected holder survey. Different country (Netherlands), different year (2010), different methodology.
Fuentes: inacción
Registro de evidencia
Cada número a continuación es lo que reportó cada fuente, con la cita textual en la que nos basamos y cómo llegamos a nuestra cifra. Haz clic en cualquier enlace para verificarlo directamente.
1/2 fuentes verificadas de forma independiente palabra por palabra frente a la fuente citada
[1]Royal Horticultural Society — RHS State of Gardening Report 2025
Fuente de referencia
38% of non-gardeners cite lack of access to indoor or outdoor growing space as the reason they do not garden; 8.5 million people have never gardened, many of whom lack access to suitable space
Extracto
“"Notably, 38% of non-gardeners had no space in which to garden. [...] 2.5m people took part in community gardening initiatives over the past three years [...] yet 8.5 million people have never gardened [...] 14.7 million adults said they would be interested in volunteering for organised community gardening sessions."
”
Datos de la fuente de
2025-01-01
Accedido
2026-05-04
Cálculo
RHS State of Gardening is the annual national survey of UK gardening participation and barriers. The 38% access-barrier figure measures the share of recent non-gardeners who attribute their non-participation to lacking space rather than lacking interest — i.e., they want to garden but cannot. This is a proxy for inaction regret: access-deprived non-gardeners represent a population that wants the outcome (a plot) but does not have it. The 14.7 million figure counts adults interested in volunteering for organised community gardening sessions; it measures interest in volunteering, not a wish for a plot, and is only a rough population-level scale check. METHODOLOGICAL CAVEAT: "cites access as the barrier" is not the same as "regrets not having a plot" — the 38% is the best available proxy, not a direct regret measurement. The waiting list data (174,000+ on UK allotment lists, average wait 4 years) corroborates the scale of unmet demand.
Independencia
The RHS is the UK's leading horticultural charity, independent of the NAS and of the van den Berg academic research. The RHS State of Gardening surveys general UK adults, not specifically allotment holders, making it methodologically complementary to the NAS holder-only survey.
[2]Environmental Health (BioMed Central / Springer) — Allotment gardening and health: a comparative survey among allotment gardeners and their neighbors without an allotment
Verificado
Revisado por pares
Non-allotment neighbors scored significantly lower on life satisfaction (2.12 vs 2.26, p<0.05) and loneliness (aged 62+: 0.80 vs 0.28) compared to allotment gardeners in the same residential areas
Extracto
“"84 percent of the allotment gardeners met the Dutch guideline [...] this norm was met by only 62 percent of the respondents in the control group."
”
Datos de la fuente de
2010-10-27
Accedido
2026-05-04
Verificación
Extracto recuperado de forma independiente y confirmado palabra por palabra frente a la fuente citada durante nuestra auditoría de fundamentación.
Cálculo
The non-gardening neighbor group in van den Berg et al. (2010) represents the inaction side: people living near allotments who do not garden. Their measurably lower life satisfaction (p<0.05) and higher loneliness scores provide peer-reviewed evidence that the non-gardening state is associated with worse wellbeing outcomes than the gardening state. This is a wellbeing gap, not a direct regret measurement, but it is the strongest controlled evidence available for the cost of the inaction choice. Used here as the independent corroborating anchor for the RHS access-barrier finding.
Independencia
Same study as cited on the action side; used here as the inaction-side comparison group. The neighbor group (n=63) and gardener group (n=121) were both recruited from the same residential areas, providing the closest available controlled comparison.
Advertencias
MEDICIONES POR PROXY — NINGUNO DE LOS DOS LADOS USA UNA PREGUNTA DIRECTA DE ARREPENTIMIENTO. Ninguna encuesta o estudio publicado en la literatura sobre huertos comunitarios pregunta directamente a los titulares si se arrepienten de haber conseguido una parcela, ni a los no titulares si se arrepienten de no tenerla. La tasa de acción del 8% es el complemento de la puntuación de satisfacción del 91,9% (NAS 2025) — una inversión de la satisfacción, no una medida de arrepentimiento. La tasa de inacción del 38% es la proporción de barrera de acceso — "cita el acceso como el motivo por el que no cultivo" ≠ "se arrepiente de no tener una parcela". Ambos son los proxies más cercanos disponibles; no existen mejores datos en la literatura publicada. SESGO DE SUPERVIVENCIA / ABANDONO: la encuesta NAS 2025 cubre solo a los titulares actuales de parcelas. Las personas que consiguieron una parcela, la encontraron insatisfactoria o demasiado exigente y la abandonaron no están representadas — su exclusión significa que la proporción real de quienes alguna vez la tuvieron y no repetirían la elección es casi con seguridad mayor que el 8% residual de no-máxima-valoración mostrado aquí, que es un proxy de la cola de satisfacción y no una tasa de arrepentimiento medida. INFLACIÓN POR DESEABILIDAD SOCIAL: el cultivo en huertos comunitarios tiene un fuerte encuadre cultural positivo en el Reino Unido (salud, comunidad, sostenibilidad). Las puntuaciones de satisfacción autodeclaradas probablemente estén infladas por efectos de deseabilidad social; los titulares pueden subestimar la insatisfacción incluso en una encuesta anónima. GRUPO DE COMPARACIÓN PEQUEÑO: la comparación bilateral revisada por pares de van den Berg (2010) — la evidencia controlada más sólida de esta entrada — utiliza solo n=63 vecinos no hortelanos junto a n=121 hortelanos de huertos comunitarios. Con este tamaño muestral, la diferencia en satisfacción vital (2,26 frente a 2,12, p<0,05) es estadísticamente significativa pero el intervalo de confianza es amplio; el tamaño del efecto debe tratarse como direccional más que como preciso. ALCANCE POBLACIONAL: todas las cifras son del Reino Unido/Europa; la cultura del huerto comunitario en EE. UU. está menos arraigada, las listas de espera son más cortas y las normas de tenencia de parcelas difieren — la transposición directa de las tasas no es apropiada. RESTRICCIONES DE ACCESO EN LA INACCIÓN: a diferencia de la mayoría de las decisiones en este conjunto de datos, la elección de inacción es con frecuencia involuntaria — más de 174.000 personas están en listas de espera del Reino Unido con esperas medias de 4 años y de hasta 12 años en algunos distritos de Londres. Una parte del grupo de "inacción" actuaría si la oferta lo permitiera, lo que complica el marco de Gilovich que asume que la inacción fue elegida libremente.