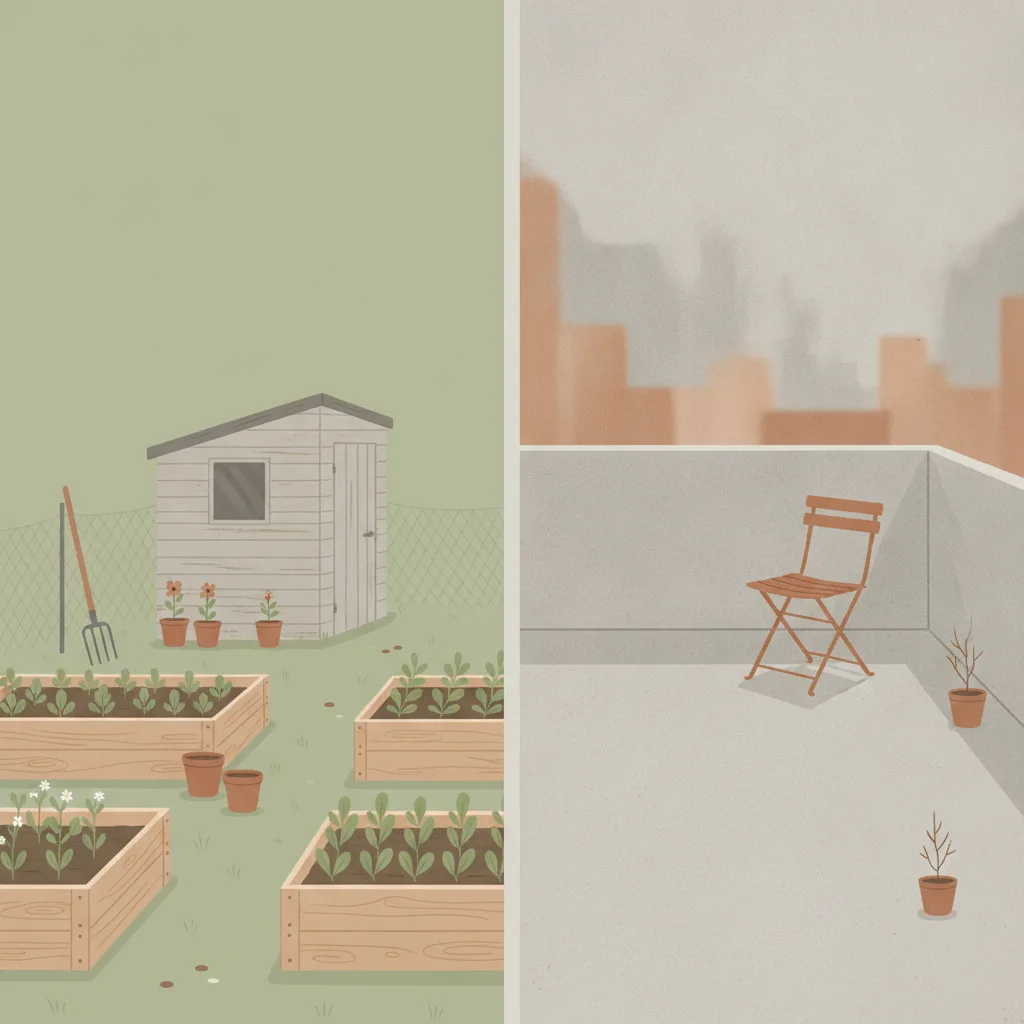
Prendere un orto urbano o una parcella di giardino comunitario vs. restarne senza
Se agisci
Prendere un orto o un giardino condiviso
8,0%
Se non agisci
Restare senza orto né appezzamento
38%
Almeno una cifra è una stima indiretta, non un tasso di rimpianto misurato. Come è stata ottenuta ogni cifra è spiegato più sotto.
Stile di vita
Ultima revisione 2026-05-04
Qualità delle prove 4.13/5
Punteggio di revisione su otto dimensioni rispetto alla
griglia di qualità
. Ogni dimensione valutata da 1 a 5.
D1 Verifica delle fonti
5/5
D2 Autorità e indipendenza delle fonti
4/5
D3 Precisione del tasso di rimpianto
2/5
D4 Comparabilità delle fonti
3/5
D5 Schema di Gilovich
5/5
D6 Qualità della prosa
5/5
D7 Completezza degli avvertimenti
5/5
D8 Qualità del campione
4/5
Media4.13/5
Dati indiretti: per questa decisione almeno una cifra deriva da una misura indiretta, come esiti, soddisfazione o intenzione, oppure da una stima della redazione, e non da un'indagine che chieda direttamente del rimpianto. Le note di ciascuna opzione, più sotto, spiegano come è stata ottenuta la cifra.
Se agisci
Prendere un orto o un giardino condiviso
8,0%
Il 91,9% dei titolari di orti valuta il beneficio del proprio appezzamento sulla salute mentale con un punteggio pari o superiore a 8/10 (proxy di soddisfazione — non esiste un sondaggio diretto sul rimpianto o sulla rinuncia all'appezzamento; il ~8% mostrato è la quota di chi non dà la valutazione massima, NON un tasso di rimpianto misurato)
Assegnatari di orti urbani in Germania, Regno Unito, Paesi Bassi, USA
abbandono a 2-3 anni
Se non agisci
Restare senza orto né appezzamento
38%
~38% dei non ortolani indica la mancanza di accesso come ragione per cui non coltiva
Adulti urbani in liste d'attesa per orti o senza accesso al giardinaggio (Regno Unito, Germania, USA)
indagini cross-sezionali, 2018-2023
Cifra per ciascuna scelta (la misura è indicata nella pagina)
Prendere un orto o un giardino condivisoRestare senza orto né appezzamento
8,0%38%
Decisioni correlate
Decisioni semanticamente simili — stesso terreno, compromessi diversi.
Cifra per ciascuna scelta (la misura è indicata nella pagina)
Perseguire attivamente la longevità (digiuno, integratori, biohacking)Accettare l'invecchiamento standard (no biohacking, assistenza medica convenzionale)
Approximately 91.9% of UK allotment plot holders rate the mental health benefit
of their plot at 8 or higher out of 10, with 63% giving a perfect 10, according to
the National Allotment Society’s 2025 survey of approximately 2,000 holders. A 2010
peer-reviewed study in Environmental Health (van den Berg et al.) reached the same
figure independently: 91% of Dutch allotment gardeners reported increased happiness
after visiting their plot, and their life satisfaction scores were significantly
higher than those of matched non-gardening neighbors drawn from the same residential
areas (2.26 vs 2.12, p<0.05). Neither survey asked holders whether they regret
their plot; both measured benefit ratings, and in both the residual 8–9% is simply
the share who did not give the top positive response rather than a count of people
who wished they had not taken a plot. No published study reports a direct allotment
regret or relinquishment-due-to-regret rate, so the figure shown here is a
satisfaction-tail proxy, not a measured regret rate. The pattern
holds across age groups but is sharpest in older adults: among those over 62, the
Dutch gardeners scored 0.32 on a composite wellbeing index versus −0.26 for same-age
neighbors, and loneliness scores diverged by a factor of nearly three.
The inaction side is structured by access rather than preference. The RHS State of
Gardening 2025 found that 38% of UK adults who had not gardened in the past year
cited lack of access to growing space as the reason — the largest single barrier,
and one that implies desire without opportunity rather than chosen non-participation.
In the same RHS survey, 14.7 million adults said they would be interested in
volunteering for organised community gardening sessions, while 2.5 million had
taken part in community gardening initiatives over the past three years. Over
174,000 people are on UK waiting lists for allotment plots at any given time, with
average waits of four years nationally and up to twelve years in some London boroughs.
This is unusual among decisions studied here: the inaction group is partly
involuntary, shaped by land supply and local authority policy rather than freely
chosen preference. Whether one frames that constraint as regret or frustration, it
is directionally the same: a large population wants the outcome and does not have it.
The Gilovich inaction-dominance pattern is among the more robust in this dataset for
this topic, though both sides rest on proxies rather than direct regret questions.
The roughly 30-percentage-point gap between the action-side satisfaction-tail proxy
(~8% non-top rating) and the inaction-side access-barrier proxy (~38% cite lack of
access) is consistent across UK survey data and the Dutch controlled study, and
it is consistent with findings in adjacent decisions like gym membership and therapy
— categories where the barrier to starting tends to feel large and the regret after
starting tends to be low. The specific mechanism is well-documented: allotment
holders visit regularly (unlike vacation cabin owners), the costs are low relative to
perceived benefit, and the social dimension of a shared site appears to add value
that solo garden ownership does not. For those fortunate enough to reach the front
of a waiting list, the decision to take the plot is almost universally reported as
the right one.
Fonti: azione
Registro delle fonti
Ogni numero qui sotto è ciò che ciascuna fonte ha riportato, con la citazione testuale su cui ci siamo basati e come siamo arrivati alla nostra cifra. Clicca su qualsiasi link per verificare direttamente.
2/2 fonti verificate in modo indipendente e alla lettera rispetto alla fonte citata
[1]National Allotment Society (via Pressat press office) — Growing the Evidence: Survey Shows the Power of Allotments
Verificato
Fonte di riferimento
91.9% of UK allotment holders rate mental health benefits at 8/10 or higher; 63% give a perfect 10/10
Estratto
“"Nearly 63% of respondents rated the impact of their allotment on mental wellbeing a perfect 10, with 91.9% scoring it 8 or higher. Physical health benefits were similarly high, with 88.1% rating them 8 or above. 89.2% increased their fresh produce intake after getting a plot. 80.3% credited their plot with forming new social relationships."
”
Dati originali da
2025-08-11
Consultato
2026-05-04
Verifica
Estratto recuperato in modo indipendente e confermato parola per parola rispetto alla fonte citata durante il nostro audit di attendibilità.
Calcolo
NAS 2025 survey of approximately 2,000 UK allotment plot holders. The survey measured benefit ratings, not regret: 91.9% rated the plot's mental-health benefit 8/10 or higher. The 8% stored as regret_rate is the arithmetic complement of that 91.9% (those who did NOT give a top-band rating), i.e. the satisfaction-score tail — NOT a dissatisfaction or regret rate. No question asked "do you regret getting an allotment", and no published survey measures allotment regret or relinquishment-due-to-regret (the 2024 Birmingham study of 876 tenants, Bloomfield, reports tenure — 9% held a plot <1 year, 36% 1–5 years — but no regret/quit rate; the 2025 APSE Local Authority State of the Market survey reports waiting-list demand, not plot abandonment). The non-top rating share is used only as the closest available proxy, with that limitation stated explicitly in the display and caveats. It is in the same range as the Netherlands peer-reviewed study (van den Berg et al. 2010), where 91% of allotment gardeners reported increased happiness after plot visits — again a positive-rating figure, not a measure of regret. The residual 8–9% in both samples is the share who did not give the top positive response, not a count of people who wished they had not taken a plot.
Indipendenza
NAS is an independent UK charity that represents allotment holders. This survey is independent of the RHS, van den Berg academic study, and any commercial or government source.
[2]Environmental Health (BioMed Central / Springer) — Allotment gardening and health: a comparative survey among allotment gardeners and their neighbors without an allotment
Verificato
Articolo peer-reviewed
91% of allotment gardeners reported increased happiness after plot visits; life satisfaction 2.26 vs 2.12 for non-gardening neighbors (p<0.05)
Estratto
“"Eighty-four percent reported feeling healthier after a visit to the allotment garden. [...] 91 percent reported feeling happier and 86 percent reported feeling less stressed."
”
Dati originali da
2010-10-27
Consultato
2026-05-04
Verifica
Estratto recuperato in modo indipendente e confermato parola per parola rispetto alla fonte citata durante il nostro audit di attendibilità.
Calcolo
van den Berg et al. (2010) surveyed 121 allotment gardeners and 63 matched non-allotment neighbors recruited from the same residential areas near 12 allotment sites in 8 Dutch cities (July–September sampling). Both groups completed the same wellbeing questionnaire, providing a genuine comparison of people who garden vs. comparable people who do not. The 91% happiness increase rate among gardeners implies approximately 9% who did not report this outcome — consistent with the NAS 2025 UK figure. Used here as the independent peer-reviewed anchor corroborating the NAS satisfaction finding.
Indipendenza
Independent of all other sources: peer-reviewed academic study published in a Springer/BioMed Central journal, conducted by Dutch university researchers (Wageningen UR), using a controlled matched-sample design rather than a self-selected holder survey. Different country (Netherlands), different year (2010), different methodology.
Fonti: inazione
Registro delle fonti
Ogni numero qui sotto è ciò che ciascuna fonte ha riportato, con la citazione testuale su cui ci siamo basati e come siamo arrivati alla nostra cifra. Clicca su qualsiasi link per verificare direttamente.
1/2 fonti verificate in modo indipendente e alla lettera rispetto alla fonte citata
[1]Royal Horticultural Society — RHS State of Gardening Report 2025
Fonte di riferimento
38% of non-gardeners cite lack of access to indoor or outdoor growing space as the reason they do not garden; 8.5 million people have never gardened, many of whom lack access to suitable space
Estratto
“"Notably, 38% of non-gardeners had no space in which to garden. [...] 2.5m people took part in community gardening initiatives over the past three years [...] yet 8.5 million people have never gardened [...] 14.7 million adults said they would be interested in volunteering for organised community gardening sessions."
”
Dati originali da
2025-01-01
Consultato
2026-05-04
Calcolo
RHS State of Gardening is the annual national survey of UK gardening participation and barriers. The 38% access-barrier figure measures the share of recent non-gardeners who attribute their non-participation to lacking space rather than lacking interest — i.e., they want to garden but cannot. This is a proxy for inaction regret: access-deprived non-gardeners represent a population that wants the outcome (a plot) but does not have it. The 14.7 million figure counts adults interested in volunteering for organised community gardening sessions; it measures interest in volunteering, not a wish for a plot, and is only a rough population-level scale check. METHODOLOGICAL CAVEAT: "cites access as the barrier" is not the same as "regrets not having a plot" — the 38% is the best available proxy, not a direct regret measurement. The waiting list data (174,000+ on UK allotment lists, average wait 4 years) corroborates the scale of unmet demand.
Indipendenza
The RHS is the UK's leading horticultural charity, independent of the NAS and of the van den Berg academic research. The RHS State of Gardening surveys general UK adults, not specifically allotment holders, making it methodologically complementary to the NAS holder-only survey.
[2]Environmental Health (BioMed Central / Springer) — Allotment gardening and health: a comparative survey among allotment gardeners and their neighbors without an allotment
Verificato
Articolo peer-reviewed
Non-allotment neighbors scored significantly lower on life satisfaction (2.12 vs 2.26, p<0.05) and loneliness (aged 62+: 0.80 vs 0.28) compared to allotment gardeners in the same residential areas
Estratto
“"84 percent of the allotment gardeners met the Dutch guideline [...] this norm was met by only 62 percent of the respondents in the control group."
”
Dati originali da
2010-10-27
Consultato
2026-05-04
Verifica
Estratto recuperato in modo indipendente e confermato parola per parola rispetto alla fonte citata durante il nostro audit di attendibilità.
Calcolo
The non-gardening neighbor group in van den Berg et al. (2010) represents the inaction side: people living near allotments who do not garden. Their measurably lower life satisfaction (p<0.05) and higher loneliness scores provide peer-reviewed evidence that the non-gardening state is associated with worse wellbeing outcomes than the gardening state. This is a wellbeing gap, not a direct regret measurement, but it is the strongest controlled evidence available for the cost of the inaction choice. Used here as the independent corroborating anchor for the RHS access-barrier finding.
Indipendenza
Same study as cited on the action side; used here as the inaction-side comparison group. The neighbor group (n=63) and gardener group (n=121) were both recruited from the same residential areas, providing the closest available controlled comparison.
Avvertenze
MISURE PROXY — NESSUNO DEI DUE LATI USA UNA DOMANDA DIRETTA SUL RIMPIANTO. Nessun sondaggio o studio pubblicato nella letteratura sugli orti sociali chiede direttamente ai titolari se rimpiangono di aver ottenuto un appezzamento, né ai non titolari se rimpiangono di non averne uno. Il tasso dell'8% sul lato azione è il complemento del punteggio di soddisfazione del 91,9% (NAS 2025) — un'inversione della soddisfazione, non una misura del rimpianto. Il tasso del 38% sul lato inazione è la quota di barriera all'accesso del lato destro — "indica l'accesso come ragione per cui non coltivo" ≠ "rimpiange di non avere un appezzamento". Entrambi sono i proxy più vicini disponibili; non esistono dati migliori nella letteratura pubblicata. BIAS DI SOPRAVVIVENZA / ABBANDONO: il sondaggio NAS 2025 copre solo gli attuali titolari di appezzamenti. Le persone che hanno acquisito un appezzamento, lo hanno trovato insoddisfacente o troppo impegnativo e vi hanno rinunciato non sono rappresentate — la loro esclusione significa che la quota reale di chi ha mai avuto un appezzamento e non ripeterebbe la scelta è quasi certamente più alta del residuo dell'8% di chi non dà la valutazione massima mostrato qui, che è un proxy della coda della soddisfazione e non un tasso di rimpianto misurato. INFLAZIONE DA DESIDERABILITÀ SOCIALE: la coltivazione degli orti sociali gode di una forte connotazione culturale positiva nel Regno Unito (salute, comunità, sostenibilità). I punteggi di soddisfazione autoriferiti sono probabilmente gonfiati da effetti di desiderabilità sociale; i titolari potrebbero sottostimare l'insoddisfazione anche in un sondaggio anonimo. PICCOLO GRUPPO DI CONFRONTO: il confronto bilaterale peer-reviewed di van den Berg (2010) — la più solida evidenza controllata di questa scheda — usa solo n=63 vicini non ortolani accanto a n=121 ortolani con appezzamento. Con questa dimensione campionaria il divario di soddisfazione di vita (2,26 vs 2,12, p<0,05) è statisticamente significativo ma l'intervallo di confidenza è ampio; l'ampiezza dell'effetto va trattata come indicativa piuttosto che precisa. AMBITO DELLA POPOLAZIONE: tutte le cifre sono relative al Regno Unito/Europa; la cultura degli orti comunitari negli Stati Uniti è meno radicata, le liste d'attesa più brevi e le norme sulla durata dell'appezzamento differiscono — la trasposizione diretta dei tassi non è appropriata. VINCOLI DI ACCESSO SULL'INAZIONE: a differenza della maggior parte delle decisioni in questo dataset, la scelta di inazione è spesso involontaria — oltre 174.000 persone sono in lista d'attesa nel Regno Unito con attese medie di 4 anni e fino a 12 anni in alcuni distretti di Londra. Una parte del gruppo dell'"inazione" agirebbe se l'offerta lo consentisse, il che complica l'inquadramento di Gilovich che presuppone che l'inazione sia stata liberamente scelta.