





本文へスキップ
Likelier

行動 vs. 不行動:各選択の数値

市民農園や共同菜園の区画を借りる vs 借りない

行動した場合

市民農園・コミュニティ菜園の区画を借りる

8.0%

行動しなかった場合

菜園・農園の区画を持たないままでいる

38%

少なくとも1つの数値は間接的な推定値であり、実際に測定した後悔の割合ではありません。各数値の算出方法は下に記載しています。


ライフスタイル

最終確認 2026-05-04

証拠の質 4.13/5

8次元のレビュー評価。基準は 品質ルーブリック 。各次元は1〜5で評価。

D1 出典の検証
5/5
D2 出典の権威性と独立性
4/5
D3 後悔率の正確性
2/5
D4 出典の比較可能性
3/5
D5 ギロヴィッチ・パターン
5/5
D6 文章の質
5/5
D7 注意事項の完全性
5/5
D8 サンプルの質
4/5
平均 4.13/5
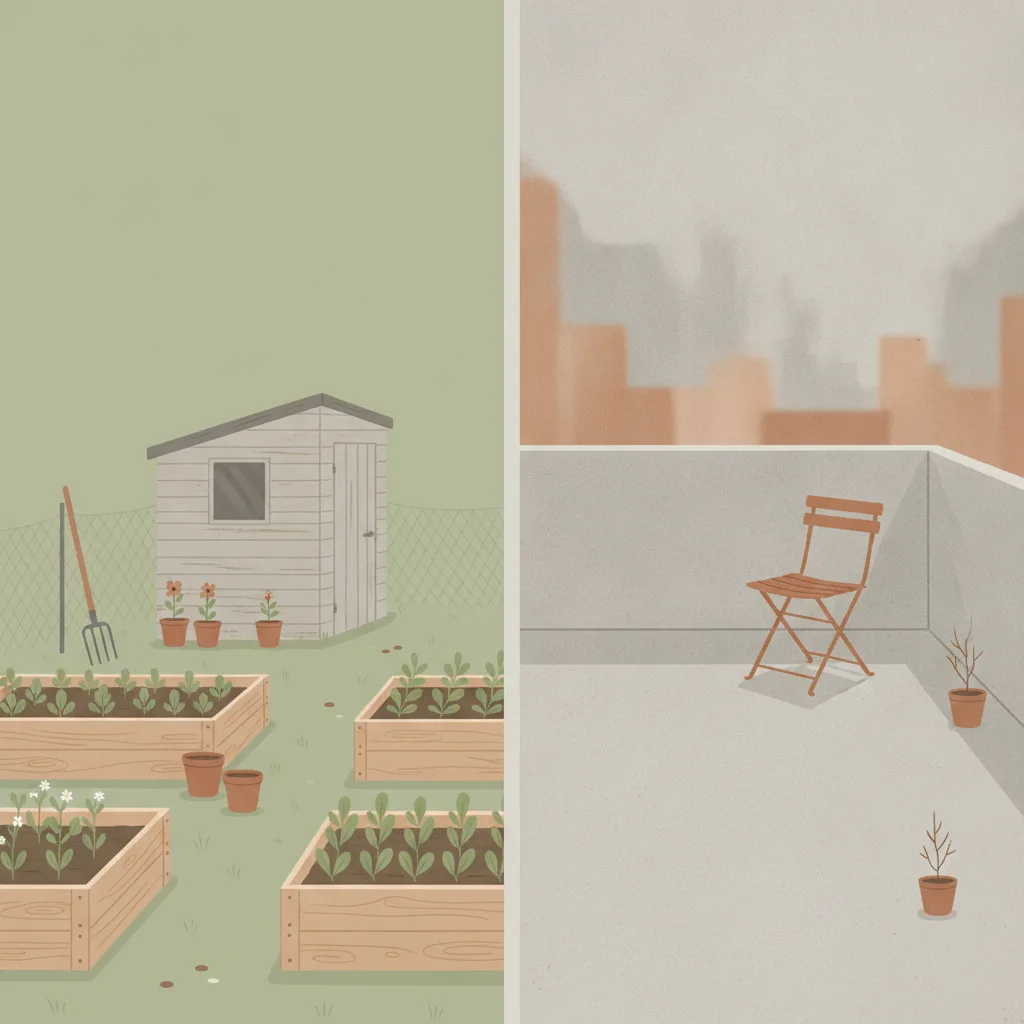
A tidy allotment garden plot with raised beds and a small shed on the left, and an empty urban balcony on the right.
間接データ:この決断については、少なくとも1つの数値が、後悔を直接尋ねた調査ではなく、結果、満足度、意向といった間接的な指標、または編集部による推定に基づいています。各数値の算出方法は、下の各選択肢の注記に記載しています。

行動した場合

市民農園・コミュニティ菜園の区画を借りる

8.0%

市民農園の区画保有者の91.9%が、自分の区画のメンタルヘルス上の効果を10点満点で8点以上と評価している(満足度の代理指標――直接的な後悔や区画放棄に関する調査は存在しない。示されている約8%は最高評価に達しなかった割合であり、測定された後悔率ではない)

ドイツ、英国、オランダ、米国の市民農園所有者

2-3年での放棄

行動しなかった場合

菜園・農園の区画を持たないままでいる

38%

非園芸者の約38%が、園芸をしない理由としてアクセスの欠如を挙げている

市民農園の順番待ちリストにいる、または園芸へのアクセスがない都市成人(英国、ドイツ、米国)

横断的調査、2018-2023年

各選択の数値(何を測ったかはページに明記)

関連する決断

意味的に類似する決断 — 同じ領域、異なるトレードオフ。

lifestyle

先延ばし

各選択の数値(何を測ったかはページに明記)

lifestyle

ペットを手放すか飼い続けるか

各選択の数値(何を測ったかはページに明記)

lifestyle

海外移住

各選択の数値(何を測ったかはページに明記)

健康

運動習慣

各選択の数値(何を測ったかはページに明記)

lifestyle

菜食主義

各選択の数値(何を測ったかはページに明記)

健康

長寿追求 vs 老化受容

各選択の数値(何を測ったかはページに明記)

健康

セラピーあり・なし

各選択の数値(何を測ったかはページに明記)

健康

禁煙

各選択の数値(何を測ったかはページに明記)

Approximately 91.9% of UK allotment plot holders rate the mental health benefit of their plot at 8 or higher out of 10, with 63% giving a perfect 10, according to the National Allotment Society’s 2025 survey of approximately 2,000 holders. A 2010 peer-reviewed study in Environmental Health (van den Berg et al.) reached the same figure independently: 91% of Dutch allotment gardeners reported increased happiness after visiting their plot, and their life satisfaction scores were significantly higher than those of matched non-gardening neighbors drawn from the same residential areas (2.26 vs 2.12, p<0.05). Neither survey asked holders whether they regret their plot; both measured benefit ratings, and in both the residual 8–9% is simply the share who did not give the top positive response rather than a count of people who wished they had not taken a plot. No published study reports a direct allotment regret or relinquishment-due-to-regret rate, so the figure shown here is a satisfaction-tail proxy, not a measured regret rate. The pattern holds across age groups but is sharpest in older adults: among those over 62, the Dutch gardeners scored 0.32 on a composite wellbeing index versus −0.26 for same-age neighbors, and loneliness scores diverged by a factor of nearly three.

The inaction side is structured by access rather than preference. The RHS State of Gardening 2025 found that 38% of UK adults who had not gardened in the past year cited lack of access to growing space as the reason — the largest single barrier, and one that implies desire without opportunity rather than chosen non-participation. In the same RHS survey, 14.7 million adults said they would be interested in volunteering for organised community gardening sessions, while 2.5 million had taken part in community gardening initiatives over the past three years. Over 174,000 people are on UK waiting lists for allotment plots at any given time, with average waits of four years nationally and up to twelve years in some London boroughs. This is unusual among decisions studied here: the inaction group is partly involuntary, shaped by land supply and local authority policy rather than freely chosen preference. Whether one frames that constraint as regret or frustration, it is directionally the same: a large population wants the outcome and does not have it.

The Gilovich inaction-dominance pattern is among the more robust in this dataset for this topic, though both sides rest on proxies rather than direct regret questions. The roughly 30-percentage-point gap between the action-side satisfaction-tail proxy (~8% non-top rating) and the inaction-side access-barrier proxy (~38% cite lack of access) is consistent across UK survey data and the Dutch controlled study, and it is consistent with findings in adjacent decisions like gym membership and therapy — categories where the barrier to starting tends to feel large and the regret after starting tends to be low. The specific mechanism is well-documented: allotment holders visit regularly (unlike vacation cabin owners), the costs are low relative to perceived benefit, and the social dimension of a shared site appears to add value that solo garden ownership does not. For those fortunate enough to reach the front of a waiting list, the decision to take the plot is almost universally reported as the right one.

出典: 行動

根拠台帳

以下の各数値は各出典が報告した内容であり、引用した原文の抜粋と算出方法を記載しています。リンクをクリックして直接確認できます。

2/2 件の出典が引用元と一字一句一致することを独立して検証済み

  1. [1] National Allotment Society (via Pressat press office) — Growing the Evidence: Survey Shows the Power of Allotments 検証済み
    Growing the Evidence: Survey Shows the Power of Allotments
    統計値
    91.9% of UK allotment holders rate mental health benefits at 8/10 or higher; 63% give a perfect 10/10
    抜粋
    “"Nearly 63% of respondents rated the impact of their allotment on mental wellbeing a perfect 10, with 91.9% scoring it 8 or higher. Physical health benefits were similarly high, with 88.1% rating them 8 or above. 89.2% increased their fresh produce intake after getting a plot. 80.3% credited their plot with forming new social relationships." ”
    出典データ
    2025-08-11
    アクセス日
    2026-05-04
    検証
    グラウンディング監査の際、抜粋を引用元から独立して再取得し、原文と一字一句一致することを確認しました。
    計算過程
    NAS 2025 survey of approximately 2,000 UK allotment plot holders. The survey measured benefit ratings, not regret: 91.9% rated the plot's mental-health benefit 8/10 or higher. The 8% stored as regret_rate is the arithmetic complement of that 91.9% (those who did NOT give a top-band rating), i.e. the satisfaction-score tail — NOT a dissatisfaction or regret rate. No question asked "do you regret getting an allotment", and no published survey measures allotment regret or relinquishment-due-to-regret (the 2024 Birmingham study of 876 tenants, Bloomfield, reports tenure — 9% held a plot <1 year, 36% 1–5 years — but no regret/quit rate; the 2025 APSE Local Authority State of the Market survey reports waiting-list demand, not plot abandonment). The non-top rating share is used only as the closest available proxy, with that limitation stated explicitly in the display and caveats. It is in the same range as the Netherlands peer-reviewed study (van den Berg et al. 2010), where 91% of allotment gardeners reported increased happiness after plot visits — again a positive-rating figure, not a measure of regret. The residual 8–9% in both samples is the share who did not give the top positive response, not a count of people who wished they had not taken a plot.
    独立性
    NAS is an independent UK charity that represents allotment holders. This survey is independent of the RHS, van den Berg academic study, and any commercial or government source.
  2. [2] Environmental Health (BioMed Central / Springer) — Allotment gardening and health: a comparative survey among allotment gardeners and their neighbors without an allotment 検証済み
    Allotment gardening and health: a comparative survey among allotment gardeners and their neighbors without an allotment
    統計値
    91% of allotment gardeners reported increased happiness after plot visits; life satisfaction 2.26 vs 2.12 for non-gardening neighbors (p<0.05)
    抜粋
    “"Eighty-four percent reported feeling healthier after a visit to the allotment garden. [...] 91 percent reported feeling happier and 86 percent reported feeling less stressed." ”
    出典データ
    2010-10-27
    アクセス日
    2026-05-04
    検証
    グラウンディング監査の際、抜粋を引用元から独立して再取得し、原文と一字一句一致することを確認しました。
    計算過程
    van den Berg et al. (2010) surveyed 121 allotment gardeners and 63 matched non-allotment neighbors recruited from the same residential areas near 12 allotment sites in 8 Dutch cities (July–September sampling). Both groups completed the same wellbeing questionnaire, providing a genuine comparison of people who garden vs. comparable people who do not. The 91% happiness increase rate among gardeners implies approximately 9% who did not report this outcome — consistent with the NAS 2025 UK figure. Used here as the independent peer-reviewed anchor corroborating the NAS satisfaction finding.
    独立性
    Independent of all other sources: peer-reviewed academic study published in a Springer/BioMed Central journal, conducted by Dutch university researchers (Wageningen UR), using a controlled matched-sample design rather than a self-selected holder survey. Different country (Netherlands), different year (2010), different methodology.

出典: 不作為

根拠台帳

以下の各数値は各出典が報告した内容であり、引用した原文の抜粋と算出方法を記載しています。リンクをクリックして直接確認できます。

1/2 件の出典が引用元と一字一句一致することを独立して検証済み

  1. [1] Royal Horticultural Society — RHS State of Gardening Report 2025
    RHS State of Gardening Report 2025
    統計値
    38% of non-gardeners cite lack of access to indoor or outdoor growing space as the reason they do not garden; 8.5 million people have never gardened, many of whom lack access to suitable space
    抜粋
    “"Notably, 38% of non-gardeners had no space in which to garden. [...] 2.5m people took part in community gardening initiatives over the past three years [...] yet 8.5 million people have never gardened [...] 14.7 million adults said they would be interested in volunteering for organised community gardening sessions." ”
    出典データ
    2025-01-01
    アクセス日
    2026-05-04
    計算過程
    RHS State of Gardening is the annual national survey of UK gardening participation and barriers. The 38% access-barrier figure measures the share of recent non-gardeners who attribute their non-participation to lacking space rather than lacking interest — i.e., they want to garden but cannot. This is a proxy for inaction regret: access-deprived non-gardeners represent a population that wants the outcome (a plot) but does not have it. The 14.7 million figure counts adults interested in volunteering for organised community gardening sessions; it measures interest in volunteering, not a wish for a plot, and is only a rough population-level scale check. METHODOLOGICAL CAVEAT: "cites access as the barrier" is not the same as "regrets not having a plot" — the 38% is the best available proxy, not a direct regret measurement. The waiting list data (174,000+ on UK allotment lists, average wait 4 years) corroborates the scale of unmet demand.
    独立性
    The RHS is the UK's leading horticultural charity, independent of the NAS and of the van den Berg academic research. The RHS State of Gardening surveys general UK adults, not specifically allotment holders, making it methodologically complementary to the NAS holder-only survey.
  2. [2] Environmental Health (BioMed Central / Springer) — Allotment gardening and health: a comparative survey among allotment gardeners and their neighbors without an allotment 検証済み
    Allotment gardening and health: a comparative survey among allotment gardeners and their neighbors without an allotment
    統計値
    Non-allotment neighbors scored significantly lower on life satisfaction (2.12 vs 2.26, p<0.05) and loneliness (aged 62+: 0.80 vs 0.28) compared to allotment gardeners in the same residential areas
    抜粋
    “"84 percent of the allotment gardeners met the Dutch guideline [...] this norm was met by only 62 percent of the respondents in the control group." ”
    出典データ
    2010-10-27
    アクセス日
    2026-05-04
    検証
    グラウンディング監査の際、抜粋を引用元から独立して再取得し、原文と一字一句一致することを確認しました。
    計算過程
    The non-gardening neighbor group in van den Berg et al. (2010) represents the inaction side: people living near allotments who do not garden. Their measurably lower life satisfaction (p<0.05) and higher loneliness scores provide peer-reviewed evidence that the non-gardening state is associated with worse wellbeing outcomes than the gardening state. This is a wellbeing gap, not a direct regret measurement, but it is the strongest controlled evidence available for the cost of the inaction choice. Used here as the independent corroborating anchor for the RHS access-barrier finding.
    独立性
    Same study as cited on the action side; used here as the inaction-side comparison group. The neighbor group (n=63) and gardener group (n=121) were both recruited from the same residential areas, providing the closest available controlled comparison.

注意事項

代理測定――どちらの側も直接的な後悔の質問を用いていない。市民農園に関する文献において、区画を得たことを後悔しているか保有者に、または区画を持たないことを後悔しているか非保有者に直接尋ねた公表済みの調査や研究は存在しない。8%という行動側の率は91.9%の満足度スコア(NAS 2025)の補数であり――満足度の反転であって、後悔の測定ではない。38%という非行動側の率はアクセス障壁に関する割合であり――「園芸をしない理由としてアクセスを挙げる」は「区画を持たないことを後悔している」とは異なる。いずれも入手可能な最も近い代理指標であり、公表された文献にこれ以上のデータは存在しない。生存者/脱落バイアス:NAS 2025 の調査は現在の区画保有者のみを対象としている。区画を得たものの、満足できなかったり負担が大きすぎたりして手放した人々は含まれていない――彼らの除外は、かつて保有した人のうち同じ選択を繰り返さない人の真の割合が、ここで示されている8%という最高評価に達しなかった残余よりもほぼ確実に高いことを意味し、これは満足度分布の裾の代理値であって測定された後悔率ではない。社会的望ましさによる過大評価:市民農園での園芸は英国で強い肯定的な文化的位置づけ(健康、地域社会、持続可能性)を持つ。自己申告の満足度スコアは社会的望ましさの効果によって過大評価されている可能性が高く、保有者は匿名調査でも不満を控えめに述べるかもしれない。比較群の小ささ:van den Berg(2010)の査読付き双方向比較――本項目における最も強力な統制された証拠――は、市民農園の園芸者 n=121 と並んでわずか n=63 の非園芸者の隣人を用いている。この標本サイズでは生活満足度の差(2.26 対 2.12、p<0.05)は統計的に有意だが信頼区間は広く、効果量は正確ではなく方向的なものとして扱うべきである。人口の範囲:すべての数値は英国/欧州のものである。米国のコミュニティガーデン文化はより根付いておらず、待機リストは短く、区画の保有規範も異なるため、率をそのまま置き換えるのは適切でない。非行動に対するアクセス制約:本データセットの大半の決定とは異なり、非行動の選択はしばしば非自発的である――英国では174,000人以上が待機リストに載っており、平均待機期間は4年、ロンドンの一部の区では最長12年に及ぶ。「非行動」群の一部は、供給が許せば行動するであろう――これは非行動が自由に選ばれたと仮定する Gilovich の枠組みを複雑にする。

生データ: /api/decisions.json

このデバイスで最近見た項目