


本文へスキップ
Likelier

行動 vs. 不行動の後悔

新車を買うか、中古車を買うか

行動した場合

新車を買う

39%

行動しなかった場合

中古車を買う

39%

それぞれの選択を後で後悔した人の割合。バーと完全な記録は下に表示されます。


金融

最終確認 2026-04-26

証拠の質 3.38/5

8次元のレビュー評価。基準は 品質ルーブリック 。各次元は1〜5で評価。

D1 出典の検証
2/5
D2 出典の権威性と独立性
3/5
D3 後悔率の正確性
2/5
D4 出典の比較可能性
2/5
D5 ギロヴィッチ・パターン
5/5
D6 文章の質
5/5
D7 注意事項の完全性
4/5
D8 サンプルの質
4/5
平均 3.38/5
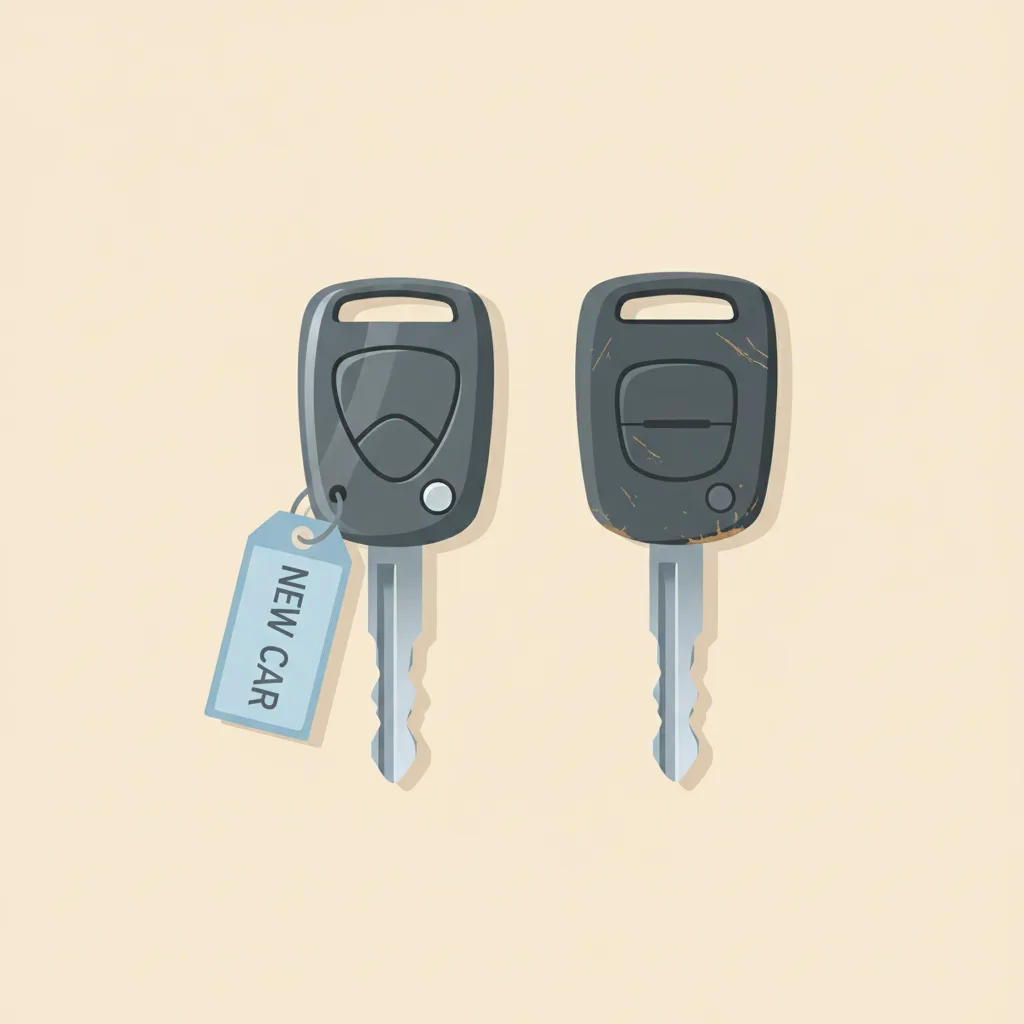
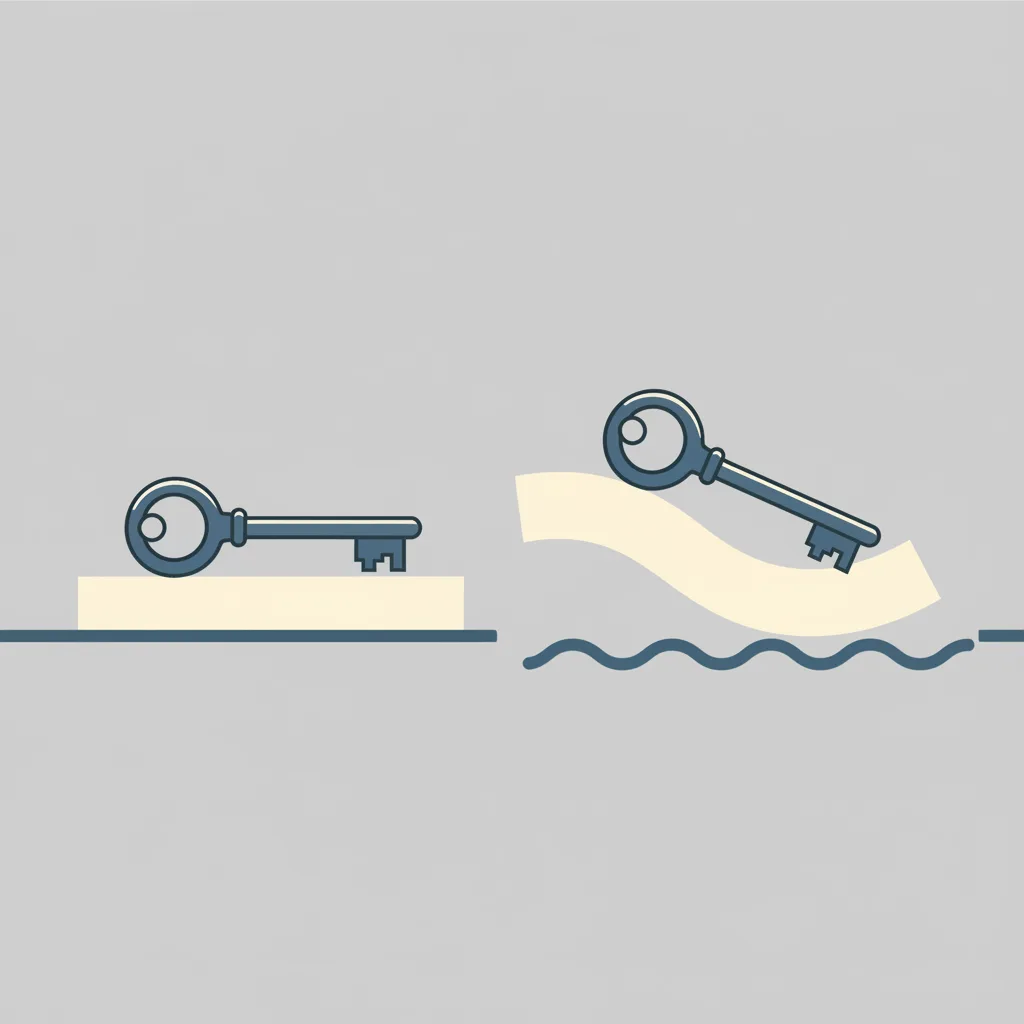
Two car keys side by side on a plain surface, one shiny and new, the other slightly worn.
代替データ — この決断に関する直接的な後悔調査は存在しません。比率は後悔を直接尋ねる質問ではなく、満足度スコアとアクセス障壁のデータから導出されています。以下の注意事項を参照してください。

行動への後悔

新車を買う

39%

全自動車購入者(新車・中古車合計)の39%が購入への後悔を報告している

米国車所有者、オンラインパネル

遡及的、所有期間は様々

不作為への後悔

中古車を買う

39%

全自動車購入者(新車・中古車合計)の約21%が不満を報告している(満足度の逆であり、中古車の後悔を直接測定したものではない)

米国車購入者、業界パネル

2024年、購入後

この選択を後悔した割合

balanced — ほぼ均衡 — どちらの選択も同程度の後悔を伴います。

関連する決断

意味的に類似する決断 — 同じ領域、異なるトレードオフ。

金融直接

適正サイズ vs. 大きめ

この選択を後悔した割合

行動が優勢

行動の後悔が1.6倍高い

金融

車の価格交渉

この選択を後悔した割合

不作為が優勢

不作為の後悔が1.6倍高い

lifestyle

EV vs ガソリン車

この選択を後悔した割合

行動が優勢

行動の後悔が2.9倍高い

career

私立大学 vs 公立大学

この選択を後悔した割合

均衡

ほぼ均衡

金融

自宅リフォーム

この選択を後悔した割合

行動が優勢

行動の後悔が2.3倍高い

金融直接

住宅購入

この選択を後悔した割合

不作為が優勢

不作為の後悔が5.6倍高い

金融

投資

この選択を後悔した割合

不作為が優勢

不作為の後悔が3.2倍高い

金融

固定金利 vs. 変動金利ローン

この選択を後悔した割合

行動が優勢

行動の後悔が3.6倍高い

About 39% of Americans who have bought a car report some form of purchase regret, according to a LendingTree survey of 1,919 US car owners. That figure covers all buyers — new and used combined; the survey never separates the two, so it cannot tell us whether new-car or used-car buyers regret more. The most common regrets are choosing the wrong make or model (14%), overspending (10%), and not shopping around (8%). Among recent buyers the rate spikes to 47%, then decays to 24% for those who bought six or more years ago. A second all-buyer source, CarGurus’ 2024 Consumer Insights Survey (n=3,150), found 79% of buyers satisfied — again not broken out by new versus used, and satisfaction is not the same thing as regret. Because no source isolates new-only from used-only regret, both sides of this pair carry the same 39% all-buyer baseline, and this entry is flagged as a proxy.

The financial mechanism is plausible even without pinning down exact figures: new vehicles carry a substantially higher purchase price and monthly payment than used ones, and depreciate fastest in the first year or two of ownership. Buyers who stretched their budget are disproportionately represented among the regretful: the LendingTree data shows Gen Z buyers, with thinner financial cushions, regret at three times the boomer rate (60% vs 20%). Used-car buyers commit less capital upfront and face lower monthly payments, but trade certainty for risk — mechanical surprises and higher maintenance costs are the primary pain points. Cox Automotive’s 2023 study found 49% of all car buyers paid more than expected, a figure that cuts across both segments but likely stings more against a higher new-car baseline price than a lower used-car one.

The honest answer is that the survey data cannot rank new against used. Neither the LendingTree nor the CarGurus study isolates new-from-used, and the CarGurus figure measures satisfaction rather than regret. The financial argument that committing more capital to a faster-depreciating asset should generate more regret is plausible, but no source in the evidence base actually measures it — so this pair reports the same all-buyer regret rate on both sides and no measured gap.

出典: 行動

根拠台帳

以下の各数値は各出典が報告した内容であり、引用した原文の抜粋と算出方法を記載しています。リンクをクリックして直接確認できます。

  1. [1] LendingTree — Nearly 4 in 10 Who Bought a Car in the Past Year Have Regrets
    Nearly 4 in 10 Who Bought a Car in the Past Year Have Regrets
    統計値
    39% of Americans who have bought a car have regrets about their purchase; 47% of those who bought within the past year regret it
    抜粋
    “"Nearly 4 in 10 (39%) Americans who have bought a car have regrets about their purchase. Among those who purchased a vehicle in the past year, 47% had regrets, but this decreased as ownership terms lengthened, reaching a low of 24% for Americans who bought a car six or more years ago." ”
    出典データ
    2024-02-14
    アクセス日
    2026-04-26
    計算過程
    LendingTree commissioned a Qualtrics survey of 1,919 US car owners (Dec. 14-20, 2021 per the published methodology). The 39% figure covers ALL car buyers (new and used combined). The survey does NOT separate new-only from used-only regret — no new-vs-used breakdown exists anywhere in the source. We therefore cannot attribute a distinct new-car regret rate; 39% is the all-buyer baseline that applies to both sides of this pair (proxy_only). Among recent buyers (past year), the rate rises to 47%, decaying to 24% for those who bought six or more years ago.
  2. [2] Cox Automotive — Cox Automotive's Car Buyer Journey Study Shows Satisfaction With Car Buying Improved in 2023
    Cox Automotive's Car Buyer Journey Study Shows Satisfaction With Car Buying Improved in 2023
    統計値
    69% of consumers were highly satisfied with the buying process in 2023, up from 61% in 2022; 49% paid more than expected
    抜粋
    “"The 2023 Car Buyer Journey Study presents a noteworthy increase in overall satisfaction, with 69% of consumers being highly satisfied with the process compared to 61% in the 2022 study. Regarding the price paid, 49% of buyers report paying more than expected, down from 54% in the 2022 study." ”
    出典データ
    2023-12-05
    アクセス日
    2026-04-26
    計算過程
    Cox Automotive's annual Car Buyer Journey study tracks satisfaction across the full buying process (new and used). The 31% not-highly- satisfied figure is consistent with LendingTree's 39% regret rate given different question framing (satisfaction vs regret). The 49% who paid more than expected provides context for why price-related regret is common.

出典: 不作為

根拠台帳

以下の各数値は各出典が報告した内容であり、引用した原文の抜粋と算出方法を記載しています。リンクをクリックして直接確認できます。

  1. [1] LendingTree — Nearly 4 in 10 Who Bought a Car in the Past Year Have Regrets
    Nearly 4 in 10 Who Bought a Car in the Past Year Have Regrets
    統計値
    39% of Americans who have bought a car have regrets; 24% for six-plus-year owners, 47% for recent buyers
    抜粋
    “"Nearly 4 in 10 (39%) Americans who have bought a car have regrets about their purchase. Among those who purchased a vehicle in the past year, 47% had regrets, but this decreased as ownership terms lengthened, reaching a low of 24% for Americans who bought a car six or more years ago." ”
    出典データ
    2024-02-14
    アクセス日
    2026-04-26
    計算過程
    Same LendingTree all-buyer survey used on the action side. Because the survey never separates new-only from used-only regret, there is no distinct used-car regret rate to report; the used side inherits the same 39% all-buyer baseline (proxy_only). Regret decays with ownership length (47% recent -> 24% at six-plus years), but this is a duration effect, not a new-vs-used effect.
  2. [2] CarGurus — CarGurus Study Uncovers Shift in Car Shopper Sentiment as Prices and Selection Improve
    CarGurus Study Uncovers Shift in Car Shopper Sentiment as Prices and Selection Improve
    統計値
    79% of car buyers were satisfied with the overall experience in 2024; 35% extremely satisfied
    抜粋
    “"79% of car buyers were satisfied with the overall car buying experience in 2024, with 35% being extremely satisfied. Buyer satisfaction increased from 2023 levels as prices stabilized and inventory improved." ”
    出典データ
    2024-12-17
    アクセス日
    2026-04-26
    計算過程
    CarGurus 2024 Consumer Insights Survey (n=3,150: 3,008 opt-in + 142 CRM sample). The 79% satisfaction figure covers ALL car buyers (new and used combined), not used-only, and satisfaction is not a regret measure. Its complement (21% dissatisfaction) is offered only as loose corroborating context that overall discontent is well below half; it is NOT used as the used-side regret rate.

注意事項

No survey in the evidence base separates new-car from used-car regret. The LendingTree study reports a single 39% regret rate across ALL car buyers (new and used combined; n=1,919, Dec. 2021) and never breaks it out by purchase type. The CarGurus 79% satisfaction figure is likewise an all-buyer measure (n=3,150, 2024) and satisfaction is not the same construct as regret. Because neither side can be given a distinct, source-grounded regret rate, both inherit the same 39% all-buyer baseline and the pair is flagged proxy_only with no measured gap (regret_delta 0). The earlier "18-point new-vs-used gap" was not supported by any source and has been removed. What the data DO show are duration and generational effects: regret falls from 47% for recent buyers to 24% for six-plus-year owners, and Gen Z regret (60%) dwarfs boomer regret (20%) — suggesting financial stress and inexperience, not new-vs-used status, are the stronger predictors. Survey data are drawn exclusively from United States samples; rates in countries with different consumer norms, pricing, and market structure may differ substantially.

生データ: /api/decisions.json

このデバイスで最近見た項目