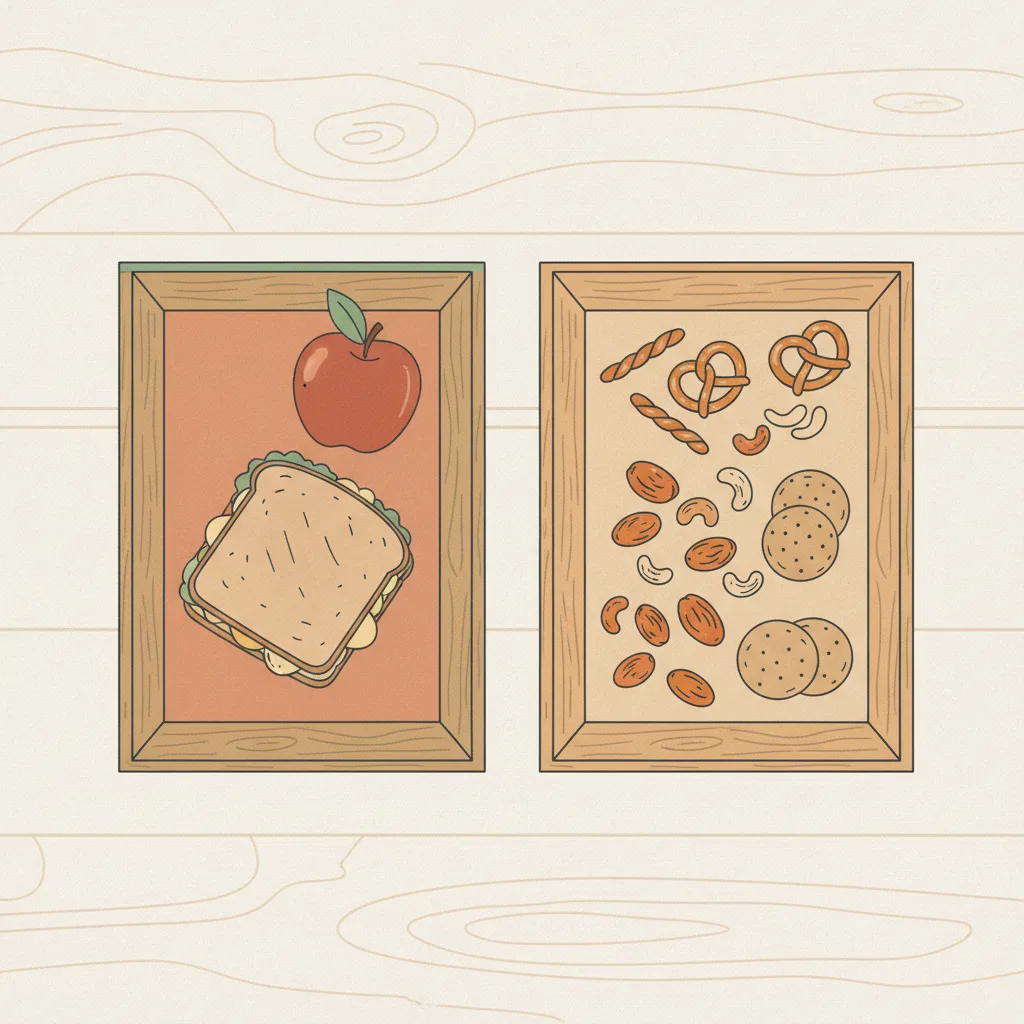
Lanches entre refeições (padrão moderno de beliscar) vs comer apenas em 2-3 refeições definidas sem lanches
Se você agir
Lanches entre refeições
15%
Se você não agir
Comer apenas em 2-3 refeições definidas (sem lanches)
27%
Porcentagem de quem mais tarde se arrepende de cada escolha. As barras e o registro completo aparecem abaixo.
Estilo de vida
Última revisão 2026-05-30
Qualidade das evidências 3.75/5
Pontuação de revisão em oito dimensões segundo a
grelha de qualidade
. Cada dimensão pontuada de 1 a 5.
D1 Verificação das fontes
4/5
D2 Autoridade e independência das fontes
5/5
D3 Precisão da taxa de arrependimento
2/5
D4 Comparabilidade das fontes
4/5
D5 Padrão de Gilovich
3/5
D6 Qualidade da prosa
4/5
D7 Completude das ressalvas
3/5
D8 Qualidade da amostra
5/5
Média3.75/5
Dados proxy — não existe nenhuma pesquisa direta sobre arrependimento para esta decisão. As taxas são derivadas de pontuações de satisfação e dados de barreiras de acesso em vez de perguntas que perguntavam diretamente sobre arrependimento. Veja advertências abaixo.
Arrependimento por ação
Lanches entre refeições
15%
~15% dos adultos dos EUA estabelecem uma resolução de Ano Novo que visa reduzir petiscos/alimentos açucarados (parcela específica de petiscos dentro do número de 25% de qualquer resolução alimentar da Purdue — intenção declarada prospectiva, não arrependimento retrospectivo)
Adultos americanos, representativos nacionalmente
transversal, coletado em janeiro de 2024
Arrependimento por omissão
Comer apenas em 2-3 refeições definidas (sem lanches)
27%
27% dos adultos dos EUA que estão ativamente tentando perder peso (proxy de intenção de controle de peso — não arrependimento direto quanto ao padrão de fazer apenas refeições)
Adultos americanos, representativos nacionalmente
transversal, coletado de 6 a 20 de novembro de 2024
% se arrependem desta escolha
Lanches entre refeiçõesComer apenas em 2-3 refeições definidas (sem lanches)
15%27%
inaction dominates — A inacção domina — a maioria arrepende-se de não ter agido.
Decisões relacionadas
Decisões semanticamente semelhantes — mesmo terreno, compromissos diferentes.
Twenty-seven percent of US adults are actively working to lose
weight, per Gallup’s November 2024 national poll of 1,001 adults
— the closest available proxy for dissatisfaction with eating patterns
that might motivate adopting a meals-only structure. That figure is
the inaction-side proxy shown above. It falls short of a direct regret
measure: the meals-only pattern is the minority position in the US,
so the question “do you regret not snacking?” is structurally rare,
and most adults who restrict to defined meals do so deliberately as
a weight-management or blood-sugar strategy rather than as a
regret-driven reversal of a prior snacking habit.
On the other side, 25% of US consumers set a food or nutrition-
related New Year’s resolution in 2024, per Purdue’s Consumer Food
Insights survey of 1,200 US adults — up six percentage points from
2023, with “the majority” planning to limit salty snacks, sugary
foods, regular soft drinks and alcohol. That 25% spans many dietary
goals, not snacking, so the action-side proxy is the snacking-specific
slice: roughly 13-18% of all US adults if “the majority” means about
half to two-thirds of those with resolutions, which we set at ~15%.
Even that ~15% is prospective intent to cut snacks, not retrospective
regret about a snacking habit. The structural
backdrop: USDA NHANES 2017-March 2020 data show 95% of US adults
snack on a given day, 78% snack multiple times, and among consumers
snacks contribute 24% of daily energy and 43% of added sugars. The
two figures come from different instruments (Purdue resolution
intent vs Gallup active weight-management) and measure different
constructs (prospective resolution vs current effort), so any
cross-side comparison is approximate.
The meal-frequency question is genuinely contested in the nutrition
literature. Bellisle’s 2014 Physiology & Behavior review concludes
that snacking neither clearly causes obesity nor clearly prevents
it, that eating frequency does not independently predict body weight
when total energy intake is controlled, and that the same eating
pattern can have different effects depending on food quality and
context. That weakens the case for either side carrying strong
regret: most US adults snack, most US adults who snack are not
measurably worse off for it when energy intake is matched, and the
few who reverse to a meals-only pattern do not have unambiguous
evidence that their previous behavior caused them measurable harm.
The ~12-point gap between the ~15% snacking-resolution share and the
27% active weight-management share is a difference between two weak,
non-comparable proxy instruments, not a measured difference in
regret. Readers should treat both figures as proxies for different
constructs and not read the delta as a precise regret comparison.
Fontes: acção
Registro de evidências
Cada número abaixo é o que cada fonte relatou, com a citação literal em que nos baseamos e como chegamos ao nosso valor. Clique em qualquer link para verificar diretamente.
1/3 fontes verificadas de forma independente palavra por palavra em relação à fonte citada
[1]News-Medical / coverage of Purdue Consumer Food Insights Jan 2024 — Increasing New Year's resolutions for healthier eating, Purdue report finds
Fonte de referência
25% of US consumers had a food/nutrition-related New Year's resolution in 2024 (up 6 pp from 2023); the majority plan to increase fruits, vegetables and water while limiting salty snacks, sugary foods, regular soft drinks and alcohol; 46% anticipate cravings as an obstacle
Trecho
“"25% of consumers responded 'yes' when asked if they had any food or nutrition-related New Year's resolutions, up 6 percentage points from the response to the same question last year... the survey-based report out of Purdue University's Center for Food Demand Analysis and Sustainability...included 1,200 consumers across the U.S."
”
Dados da fonte de
2024-02-15
Acessado
2026-05-30
Cálculo
Purdue Center for Food Demand Analysis and Sustainability, Consumer Food Insights, Volume 3 Issue 1, January 2024, N=1,200 US consumers. The 25% headline is the share of US consumers with ANY food/nutrition-related New Year's resolution, covering many dietary goals (more fruit/veg/water, less salty snacks, sugary foods, soft drinks, alcohol) — it is NOT a snacking-specific figure and NOT a regret measure. Because the report says \"the majority\" of those resolutions target the salty-snacks/sugary-foods/soft-drinks/alcohol basket (not snacking alone), the snacking-targeted share is roughly 0.25 x ~50-70% = 13-18% of all US adults. We therefore set the action-side proxy to the midpoint, ~15% (regret_rate 0.15), and label it explicitly as prospective resolution intent to cut snacks/sugary foods, not retrospective regret about snacking. The earlier 25% figure fused the all-resolutions headline with a snacking claim and overstated the snacking-targeted signal; this has been corrected.
Independência
Independent academic survey from Purdue's Center for Food Demand Analysis and Sustainability with publicly disclosed methodology; no commercial sponsorship of the consumer insights series.
[2]USDA Agricultural Research Service / Sebastian, Hoy, Goldman, Moshfegh — Snack Consumption by U.S. Adults: What We Eat in America, NHANES 2017 - March 2020
Relatório governamental
95% of US adults aged 20+ consume one or more foods or beverages as a snack on the intake day; 78% consume two or more snacks; snacks provide on average 24% of daily energy and 43% of added sugars among consumers
Trecho
“"Among adults aged 20 years and older, 95% consume one or more foods and/or beverages at a snack on the intake day... Currently, consuming multiple snacks is the norm, with 78% consuming two or more on any given day. Among consumers, snacks provide on average 24% of daily intake of energy and 43% of added sugars."
”
Dados da fonte de
2024-04-01
Acessado
2026-05-30
Cálculo
USDA Dietary Data Brief No. 53, based on NHANES 2017-March 2020 nationally representative dietary recall data. Establishes the prevalence baseline: 95% of US adults snack at least once on a given day; 78% snack multiple times; snacks contribute 24% of daily energy and 43% of added sugars on average. Used here on the action side as the govt_report context: snacking is the normal modern US eating pattern, not a deviation. This is NOT the regret-rate figure; that is from Purdue Jan 2024 (see above). The NHANES data establishes that the question \"do you regret snacking?\" applies to nearly all US adults if at all, and that the dietary stakes (43% of added sugars from snacks among consumers) are concrete.
Independência
US federal government data (NHANES via USDA ARS) with publicly disclosed methodology; no commercial sponsorship of the survey or analysis. Independent of the Purdue insights series.
[3]Journal of Nutrition / Piernas & Popkin — Snacking Increased among U.S. Adults between 1977 and 2006
Verificado
Revisado por pares
US adult snacking prevalence increased from 71% to 97% between 1977-78 and 2003-06; contribution of snacks to total energy intake increased from 18% to 24%
Trecho
“"snacking prevalence increased significantly from 71 to 97% in 2003-2006... the percentage of snacking on both d 1 and d 2 increased from 42 to 78%... the contribution of snacks to total energy intake increased from 18 to 24%."
”
Dados da fonte de
2010-02-01
Acessado
2026-05-30
Verificação
Trecho obtido novamente de forma independente e confirmado palavra por palavra em relação à fonte citada durante nossa auditoria de fundamentação.
Cálculo
Piernas & Popkin (J Nutr 2010) established the long-run shift: US adult snacking went from a minority behavior (71% on any given day in 1977-78) to near-universal (97% by 2003-06), with the share of daily energy from snacks rising from 18% to 24%. Used on the action side as the peer-reviewed historical baseline for the prevalence claim above. This is NOT the action-side regret-rate figure; that is the snacking-specific share (~15%) derived from Purdue's January 2024 resolution survey (see above). Snacking-related regret has not been directly surveyed in the US, so the action side relies on a prospective resolution-intent proxy, not a retrospective regret measure.
Independência
Independent academic analysis of CDC NHANES data; methodology publicly disclosed. No commercial sponsorship of the analysis.
Fontes: inacção
Registro de evidências
Cada número abaixo é o que cada fonte relatou, com a citação literal em que nos baseamos e como chegamos ao nosso valor. Clique em qualquer link para verificar diretamente.
2/2 fontes verificadas de forma independente palavra por palavra em relação à fonte citada
[1]Gallup News — 43% of Americans Say They Are Overweight; 55% Want to Slim Down
Verificado
↗ 1 other entry
Fonte de referência
27% of US adults are actively working to lose weight; 55% want to lose weight; 43% view themselves as overweight
Trecho
“"43%, view themselves as overweight... 55%, say they want to lose weight... only 27% report they are actively working toward that goal."
”
Dados da fonte de
2024-12-10
Acessado
2026-05-30
Verificação
Trecho obtido novamente de forma independente e confirmado palavra por palavra em relação à fonte citada durante nossa auditoria de fundamentação.
Cálculo
Gallup national poll, N=1,001 US adults, fielded November 6-20, 2024, margin of error ±4 percentage points. Used here as the inaction-side proxy: 27% of US adults are actively pursuing weight management, a state that implies current dissatisfaction with some aspect of current eating behavior including the absence of structural snacking discipline. This is NOT a direct regret measure about the meals-only pattern; in fact, the meals-only pattern is the minority position (95% of US adults snack daily per NHANES), so the question \"do you regret not snacking?\" is structurally rare. The 27% captures the directional signal: a substantial minority of US adults are actively dissatisfied enough with their current diet to do something about it, and \"cut the snacks\" is one of the most common dietary-change targets in popular guidance.
Independência
Independent Gallup national poll using random-digit-dial methodology; no shared sample with USDA NHANES or Piernas & Popkin. Different methodology and different construct.
[2]Physiology & Behavior / France Bellisle — Meals and snacking, diet quality and energy balance
Verificado
Revisado por pares
Snacking may contribute to excess energy intake and weight gain via context, frequency and food quality; in some reports snacking facilitates energy-intake adjustment to needs, in others (especially obese populations) it contributes energy but little nutrition
Trecho
“"Snacking may contribute to excess energy intake and weight gain through different ways, for example: context/environment of eating, frequency of consumption and quality of food choices. In many reports, snacking appears to facilitate the adjustment of energy intake to needs, and to contribute carbohydrates, rather than fats, to the diet. By contrast, snacking often appears to contribute much energy but little nutrition in the diet of other consumers, particularly obese children and adults."
”
Dados da fonte de
2014-07-01
Acessado
2026-05-30
Verificação
Trecho obtido novamente de forma independente e confirmado palavra por palavra em relação à fonte citada durante nossa auditoria de fundamentação.
Cálculo
Bellisle (Physiology & Behavior 2014) is the canonical peer- reviewed review framing the meal-frequency literature. The critical finding: eating frequency does not independently predict body weight when total energy intake is controlled. Used here on the inaction side as the literature basis for the observation that the case for a meals-only pattern is genuinely contested — snacking neither clearly causes obesity nor clearly prevents it, and the same eating pattern can have different effects depending on food quality and context. This is NOT the regret rate; that is from Gallup 2024. Bellisle's review provides the scientific context that weakens the case for the inaction side carrying strong regret: most US adults snack, most US adults who snack are not measurably worse off for it when energy intake is matched, and the few who reverse to a meals-only pattern do not have unambiguous evidence that their previous behavior was harmful.
Independência
Independent peer-reviewed academic review with publicly disclosed methodology; Bellisle has published widely on eating frequency, including some industry-funded studies on snacking listed in her overall body of work but the 2014 P&B review is not directly industry-sponsored.
Ressalvas
Nenhum dos lados mede o arrependimento diretamente, e nenhuma pesquisa publicada nos EUA pergunta de forma direta "você se arrepende de petiscar entre as refeições?" ou "você se arrepende de não petiscar?". A questão da frequência das refeições é genuinamente contestada na literatura de nutrição (Bellisle 2014, Physiol Behav): a frequência alimentar não prediz de forma independente o peso corporal quando a ingestão total de energia é controlada. A pesquisa Purdue Consumer Food Insights de janeiro de 2024 constatou que 25% dos consumidores dos EUA têm ALGUMA resolução de Ano Novo relacionada a alimentação/nutrição; esses 25% abrangem muitas metas dietéticas, não apenas os petiscos. Como "a maioria" dessas resoluções tem como alvo a categoria de petiscos salgados/alimentos açucarados/refrigerantes/álcool, a parcela específica de petiscos é de aproximadamente 13-18% de todos os adultos dos EUA, portanto definimos o proxy do lado da ação no ponto médio, ~15%. (Uma versão anterior usava os 25% completos, o que fundia o número de destaque de todas as resoluções com uma afirmação sobre petiscos e superestimava o sinal da ação.) Mesmo em 15%, isto é intenção prospectiva de resolução, não arrependimento retrospectivo quanto a petiscar. Os 27% do lado da inação são a parcela da Gallup de novembro de 2024 de adultos dos EUA que estão ativamente tentando perder peso — um sinal relacionado, mas indireto, e o padrão de fazer apenas refeições é, em si, a posição minoritária nos EUA (95% dos adultos dos EUA petiscam diariamente, segundo o USDA NHANES 2017-março de 2020), de modo que a pergunta "você se arrepende de não petiscar?" é estruturalmente rara. Usamos o número de 27% de esforço ativo de perda de peso como o proxy adjacente ao arrependimento disponível mais próximo. Os dois números vêm de instrumentos e populações diferentes (pesquisa de intenção de resolução da Purdue versus enquete de controle ativo de peso da Gallup) e medem constructos diferentes (resolução prospectiva versus esforço atual), portanto qualquer comparação entre os lados é aproximada e não deve ser lida como uma diferença de arrependimento precisa. O regret_delta de ~12 pontos reflete dois instrumentos proxy não comparáveis, e não uma diferença medida de arrependimento. Subjacente à questão do arrependimento está a causalidade contestada: os dados do NHANES mostram que os petiscos contribuem com 24% da energia diária e 43% dos açúcares adicionados entre os consumidores, o que estabelece o padrão de petiscar como um dos principais contribuintes para a ingestão de calorias pobres em nutrientes, mas a revisão de Bellisle argumenta que a dimensão da frequência das refeições é em grande parte subordinada à ingestão total de energia e à qualidade dos alimentos.