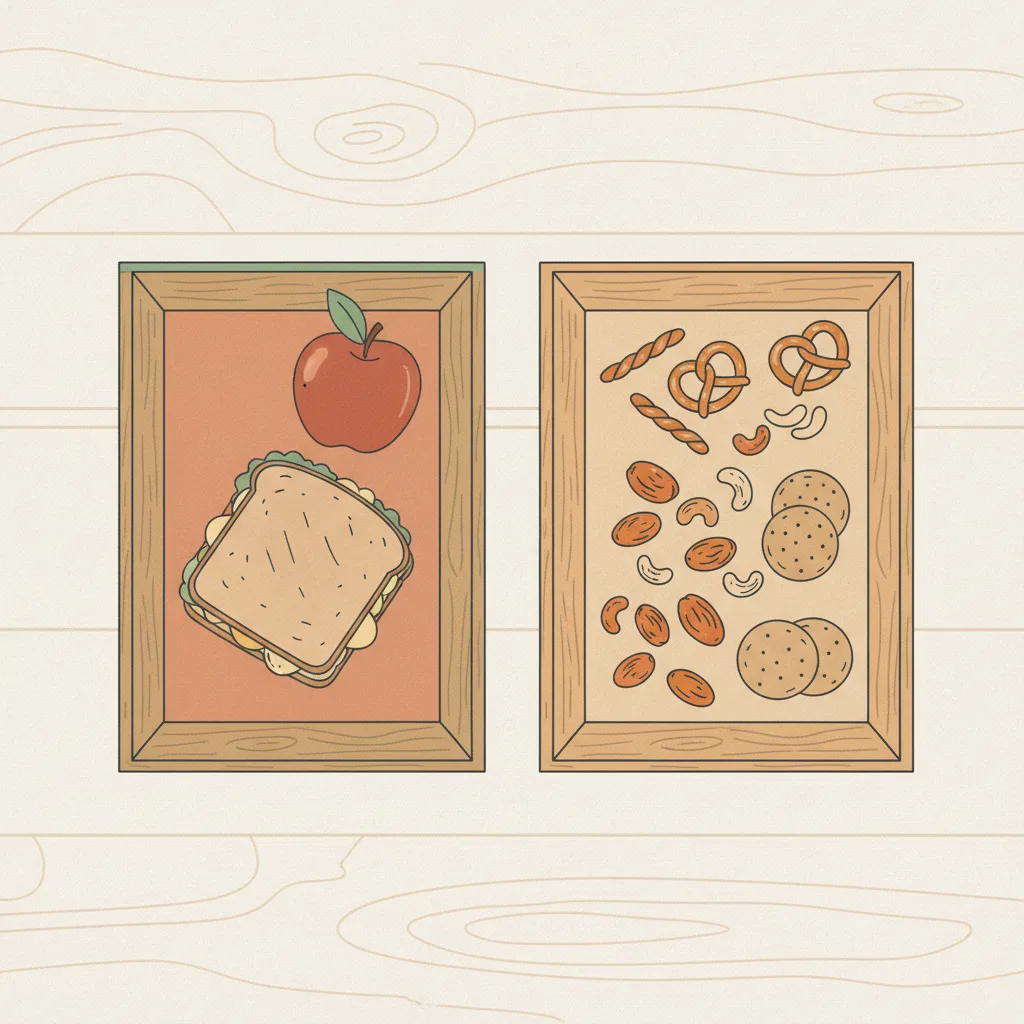
Grignoter entre les repas (schéma de pâturage moderne) vs ne manger qu'à 2-3 repas définis sans en-cas
Si vous agissez
Grignoter entre les repas
15%
Si vous n’agissez pas
Ne manger qu'à 2-3 repas définis (sans en-cas)
27%
Pourcentage de personnes qui regrettent ensuite chaque choix. Les barres et le registre complet s’affichent ci-dessous.
Mode de vie
Dernière révision 2026-05-30
Qualité des preuves 3.75/5
Score d’évaluation en huit dimensions selon la
grille de qualité
. Chaque dimension notée de 1 à 5.
D1 Vérification des sources
4/5
D2 Autorité et indépendance des sources
5/5
D3 Précision du taux de regret
2/5
D4 Comparabilité des sources
4/5
D5 Motif de Gilovich
3/5
D6 Qualité de la prose
4/5
D7 Complétude des réserves
3/5
D8 Qualité de l’échantillon
5/5
Moyenne3.75/5
Données de substitution — aucune enquête directe sur les regrets n'existe pour cette décision. Les taux sont dérivés des scores de satisfaction et des obstacles d'accès plutôt que de questions portant directement sur les regrets. Voir les mises en garde ci-dessous.
Regret d'action
Grignoter entre les repas
15%
~15 % des adultes américains se fixent une résolution du Nouvel An visant à réduire les collations/aliments sucrés (part propre aux collations du chiffre de 25 % de Purdue pour toute résolution alimentaire — intention prospective déclarée, et non regret rétrospectif)
Adultes américains, représentatifs au niveau national
transversal, recueilli en janvier 2024
Regret d'inaction
Ne manger qu'à 2-3 repas définis (sans en-cas)
27%
27 % des adultes américains cherchant activement à perdre du poids (substitut d'intention de gestion du poids — et non un regret direct concernant le schéma des repas uniquement)
Adultes américains, représentatifs au niveau national
transversal, recueilli du 6 au 20 novembre 2024
% regrettent ce choix
Grignoter entre les repasNe manger qu'à 2-3 repas définis (sans en-cas)
15%27%
inaction dominates — L'inaction domine — la plupart regrettent de ne pas avoir agi.
Décisions associées
Décisions sémantiquement similaires — même terrain, compromis différents.
Poursuite active de la longévité (jeûne, suppléments, biohacking)Accepter le vieillissement standard (pas de biohacking, soins médicaux conventionnels)
Twenty-seven percent of US adults are actively working to lose
weight, per Gallup’s November 2024 national poll of 1,001 adults
— the closest available proxy for dissatisfaction with eating patterns
that might motivate adopting a meals-only structure. That figure is
the inaction-side proxy shown above. It falls short of a direct regret
measure: the meals-only pattern is the minority position in the US,
so the question “do you regret not snacking?” is structurally rare,
and most adults who restrict to defined meals do so deliberately as
a weight-management or blood-sugar strategy rather than as a
regret-driven reversal of a prior snacking habit.
On the other side, 25% of US consumers set a food or nutrition-
related New Year’s resolution in 2024, per Purdue’s Consumer Food
Insights survey of 1,200 US adults — up six percentage points from
2023, with “the majority” planning to limit salty snacks, sugary
foods, regular soft drinks and alcohol. That 25% spans many dietary
goals, not snacking, so the action-side proxy is the snacking-specific
slice: roughly 13-18% of all US adults if “the majority” means about
half to two-thirds of those with resolutions, which we set at ~15%.
Even that ~15% is prospective intent to cut snacks, not retrospective
regret about a snacking habit. The structural
backdrop: USDA NHANES 2017-March 2020 data show 95% of US adults
snack on a given day, 78% snack multiple times, and among consumers
snacks contribute 24% of daily energy and 43% of added sugars. The
two figures come from different instruments (Purdue resolution
intent vs Gallup active weight-management) and measure different
constructs (prospective resolution vs current effort), so any
cross-side comparison is approximate.
The meal-frequency question is genuinely contested in the nutrition
literature. Bellisle’s 2014 Physiology & Behavior review concludes
that snacking neither clearly causes obesity nor clearly prevents
it, that eating frequency does not independently predict body weight
when total energy intake is controlled, and that the same eating
pattern can have different effects depending on food quality and
context. That weakens the case for either side carrying strong
regret: most US adults snack, most US adults who snack are not
measurably worse off for it when energy intake is matched, and the
few who reverse to a meals-only pattern do not have unambiguous
evidence that their previous behavior caused them measurable harm.
The ~12-point gap between the ~15% snacking-resolution share and the
27% active weight-management share is a difference between two weak,
non-comparable proxy instruments, not a measured difference in
regret. Readers should treat both figures as proxies for different
constructs and not read the delta as a precise regret comparison.
Sources : action
Registre des sources
Chaque chiffre ci-dessous correspond à ce que la source a rapporté, avec la citation textuelle sur laquelle nous nous sommes appuyés et la méthode de calcul. Cliquez sur un lien pour vérifier directement.
1/3 sources vérifiées de manière indépendante, mot pour mot, par rapport à la source citée
[1]News-Medical / coverage of Purdue Consumer Food Insights Jan 2024 — Increasing New Year's resolutions for healthier eating, Purdue report finds
Source de référence
25% of US consumers had a food/nutrition-related New Year's resolution in 2024 (up 6 pp from 2023); the majority plan to increase fruits, vegetables and water while limiting salty snacks, sugary foods, regular soft drinks and alcohol; 46% anticipate cravings as an obstacle
Extrait
“"25% of consumers responded 'yes' when asked if they had any food or nutrition-related New Year's resolutions, up 6 percentage points from the response to the same question last year... the survey-based report out of Purdue University's Center for Food Demand Analysis and Sustainability...included 1,200 consumers across the U.S."
”
Données source de
2024-02-15
Consulté le
2026-05-30
Calcul
Purdue Center for Food Demand Analysis and Sustainability, Consumer Food Insights, Volume 3 Issue 1, January 2024, N=1,200 US consumers. The 25% headline is the share of US consumers with ANY food/nutrition-related New Year's resolution, covering many dietary goals (more fruit/veg/water, less salty snacks, sugary foods, soft drinks, alcohol) — it is NOT a snacking-specific figure and NOT a regret measure. Because the report says \"the majority\" of those resolutions target the salty-snacks/sugary-foods/soft-drinks/alcohol basket (not snacking alone), the snacking-targeted share is roughly 0.25 x ~50-70% = 13-18% of all US adults. We therefore set the action-side proxy to the midpoint, ~15% (regret_rate 0.15), and label it explicitly as prospective resolution intent to cut snacks/sugary foods, not retrospective regret about snacking. The earlier 25% figure fused the all-resolutions headline with a snacking claim and overstated the snacking-targeted signal; this has been corrected.
Indépendance
Independent academic survey from Purdue's Center for Food Demand Analysis and Sustainability with publicly disclosed methodology; no commercial sponsorship of the consumer insights series.
[2]USDA Agricultural Research Service / Sebastian, Hoy, Goldman, Moshfegh — Snack Consumption by U.S. Adults: What We Eat in America, NHANES 2017 - March 2020
Rapport gouvernemental
95% of US adults aged 20+ consume one or more foods or beverages as a snack on the intake day; 78% consume two or more snacks; snacks provide on average 24% of daily energy and 43% of added sugars among consumers
Extrait
“"Among adults aged 20 years and older, 95% consume one or more foods and/or beverages at a snack on the intake day... Currently, consuming multiple snacks is the norm, with 78% consuming two or more on any given day. Among consumers, snacks provide on average 24% of daily intake of energy and 43% of added sugars."
”
Données source de
2024-04-01
Consulté le
2026-05-30
Calcul
USDA Dietary Data Brief No. 53, based on NHANES 2017-March 2020 nationally representative dietary recall data. Establishes the prevalence baseline: 95% of US adults snack at least once on a given day; 78% snack multiple times; snacks contribute 24% of daily energy and 43% of added sugars on average. Used here on the action side as the govt_report context: snacking is the normal modern US eating pattern, not a deviation. This is NOT the regret-rate figure; that is from Purdue Jan 2024 (see above). The NHANES data establishes that the question \"do you regret snacking?\" applies to nearly all US adults if at all, and that the dietary stakes (43% of added sugars from snacks among consumers) are concrete.
Indépendance
US federal government data (NHANES via USDA ARS) with publicly disclosed methodology; no commercial sponsorship of the survey or analysis. Independent of the Purdue insights series.
[3]Journal of Nutrition / Piernas & Popkin — Snacking Increased among U.S. Adults between 1977 and 2006
Vérifié
Revue par les pairs
US adult snacking prevalence increased from 71% to 97% between 1977-78 and 2003-06; contribution of snacks to total energy intake increased from 18% to 24%
Extrait
“"snacking prevalence increased significantly from 71 to 97% in 2003-2006... the percentage of snacking on both d 1 and d 2 increased from 42 to 78%... the contribution of snacks to total energy intake increased from 18 to 24%."
”
Données source de
2010-02-01
Consulté le
2026-05-30
Vérification
Extrait récupéré et confirmé de manière indépendante, mot pour mot, par rapport à la source citée lors de notre audit de vérification.
Calcul
Piernas & Popkin (J Nutr 2010) established the long-run shift: US adult snacking went from a minority behavior (71% on any given day in 1977-78) to near-universal (97% by 2003-06), with the share of daily energy from snacks rising from 18% to 24%. Used on the action side as the peer-reviewed historical baseline for the prevalence claim above. This is NOT the action-side regret-rate figure; that is the snacking-specific share (~15%) derived from Purdue's January 2024 resolution survey (see above). Snacking-related regret has not been directly surveyed in the US, so the action side relies on a prospective resolution-intent proxy, not a retrospective regret measure.
Indépendance
Independent academic analysis of CDC NHANES data; methodology publicly disclosed. No commercial sponsorship of the analysis.
Sources : inaction
Registre des sources
Chaque chiffre ci-dessous correspond à ce que la source a rapporté, avec la citation textuelle sur laquelle nous nous sommes appuyés et la méthode de calcul. Cliquez sur un lien pour vérifier directement.
2/2 sources vérifiées de manière indépendante, mot pour mot, par rapport à la source citée
[1]Gallup News — 43% of Americans Say They Are Overweight; 55% Want to Slim Down
Vérifié
↗ 1 other entry
Source de référence
27% of US adults are actively working to lose weight; 55% want to lose weight; 43% view themselves as overweight
Extrait
“"43%, view themselves as overweight... 55%, say they want to lose weight... only 27% report they are actively working toward that goal."
”
Données source de
2024-12-10
Consulté le
2026-05-30
Vérification
Extrait récupéré et confirmé de manière indépendante, mot pour mot, par rapport à la source citée lors de notre audit de vérification.
Calcul
Gallup national poll, N=1,001 US adults, fielded November 6-20, 2024, margin of error ±4 percentage points. Used here as the inaction-side proxy: 27% of US adults are actively pursuing weight management, a state that implies current dissatisfaction with some aspect of current eating behavior including the absence of structural snacking discipline. This is NOT a direct regret measure about the meals-only pattern; in fact, the meals-only pattern is the minority position (95% of US adults snack daily per NHANES), so the question \"do you regret not snacking?\" is structurally rare. The 27% captures the directional signal: a substantial minority of US adults are actively dissatisfied enough with their current diet to do something about it, and \"cut the snacks\" is one of the most common dietary-change targets in popular guidance.
Indépendance
Independent Gallup national poll using random-digit-dial methodology; no shared sample with USDA NHANES or Piernas & Popkin. Different methodology and different construct.
[2]Physiology & Behavior / France Bellisle — Meals and snacking, diet quality and energy balance
Vérifié
Revue par les pairs
Snacking may contribute to excess energy intake and weight gain via context, frequency and food quality; in some reports snacking facilitates energy-intake adjustment to needs, in others (especially obese populations) it contributes energy but little nutrition
Extrait
“"Snacking may contribute to excess energy intake and weight gain through different ways, for example: context/environment of eating, frequency of consumption and quality of food choices. In many reports, snacking appears to facilitate the adjustment of energy intake to needs, and to contribute carbohydrates, rather than fats, to the diet. By contrast, snacking often appears to contribute much energy but little nutrition in the diet of other consumers, particularly obese children and adults."
”
Données source de
2014-07-01
Consulté le
2026-05-30
Vérification
Extrait récupéré et confirmé de manière indépendante, mot pour mot, par rapport à la source citée lors de notre audit de vérification.
Calcul
Bellisle (Physiology & Behavior 2014) is the canonical peer- reviewed review framing the meal-frequency literature. The critical finding: eating frequency does not independently predict body weight when total energy intake is controlled. Used here on the inaction side as the literature basis for the observation that the case for a meals-only pattern is genuinely contested — snacking neither clearly causes obesity nor clearly prevents it, and the same eating pattern can have different effects depending on food quality and context. This is NOT the regret rate; that is from Gallup 2024. Bellisle's review provides the scientific context that weakens the case for the inaction side carrying strong regret: most US adults snack, most US adults who snack are not measurably worse off for it when energy intake is matched, and the few who reverse to a meals-only pattern do not have unambiguous evidence that their previous behavior was harmful.
Indépendance
Independent peer-reviewed academic review with publicly disclosed methodology; Bellisle has published widely on eating frequency, including some industry-funded studies on snacking listed in her overall body of work but the 2014 P&B review is not directly industry-sponsored.
Réserves
Aucun des deux côtés ne mesure directement le regret, et aucune enquête américaine publiée ne demande de front « regrettez-vous de grignoter entre les repas ? » ou « regrettez-vous de ne pas grignoter ? ». La question de la fréquence des repas est réellement contestée dans la littérature nutritionnelle (Bellisle 2014, Physiol Behav) : la fréquence des prises alimentaires ne prédit pas indépendamment le poids corporel lorsque l'apport énergétique total est maîtrisé. L'enquête Purdue Consumer Food Insights de janvier 2024 a constaté que 25 % des consommateurs américains ont UNE résolution alimentaire/nutritionnelle du Nouvel An ; ces 25 % couvrent de nombreux objectifs alimentaires, et non les collations. Étant donné que « la majorité » de ces résolutions visent le panier collations salées/aliments sucrés/boissons gazeuses/alcool, la part propre aux collations représente environ 13 à 18 % de l'ensemble des adultes américains, si bien que nous fixons le substitut du côté action au point médian, ~15 %. (Une version antérieure utilisait les 25 % complets, ce qui fusionnait le titre toutes-résolutions avec une affirmation sur les collations et surestimait le signal d'action.) Même à 15 %, il s'agit d'une intention de résolution prospective, et non d'un regret rétrospectif concernant les collations. Les 27 % du côté inaction sont la part Gallup de novembre 2024 des adultes américains cherchant activement à perdre du poids — un signal apparenté mais indirect, et le schéma des repas uniquement est lui-même la position minoritaire aux États-Unis (95 % des adultes américains grignotent quotidiennement selon l'USDA NHANES 2017-mars 2020), si bien que la question « regrettez-vous de ne pas grignoter ? » est structurellement rare. Nous utilisons le chiffre de 27 % d'effort actif de perte de poids comme le substitut apparenté au regret le plus proche disponible. Les deux chiffres proviennent d'instruments et de populations différents (enquête Purdue sur l'intention de résolution contre sondage Gallup sur la gestion active du poids) et mesurent des concepts différents (résolution prospective contre effort actuel), si bien que toute comparaison entre les côtés est approximative et ne doit pas être lue comme un écart de regret précis. Le regret_delta d'environ 12 points reflète deux instruments de substitution non comparables, et non une différence mesurée de regret. Sous-jacente à la question du regret se trouve la causalité contestée : les données NHANES montrent que les collations contribuent à 24 % de l'énergie quotidienne et à 43 % des sucres ajoutés chez les consommateurs, ce qui établit le schéma de grignotage comme un contributeur majeur à un apport calorique pauvre en nutriments, mais la revue de Bellisle soutient que la dimension de fréquence des repas est largement subordonnée à l'apport énergétique total et à la qualité des aliments.