

本文へスキップ
Likelier

行動 vs. 不行動の後悔

裁判所の判決に控訴する vs. 原判決を受け入れる

行動した場合

判決を不服として控訴する

86%

行動しなかった場合

控訴せず元の判決を受け入れる

60%

それぞれの選択を後で後悔した人の割合。バーと完全な記録は下に表示されます。


金融

最終確認 2026-05-09

証拠の質 3.63/5

8次元のレビュー評価。基準は 品質ルーブリック 。各次元は1〜5で評価。

D1 出典の検証
4/5
D2 出典の権威性と独立性
4/5
D3 後悔率の正確性
1/5
D4 出典の比較可能性
2/5
D5 ギロヴィッチ・パターン
5/5
D6 文章の質
4/5
D7 注意事項の完全性
5/5
D8 サンプルの質
4/5
平均 3.63/5
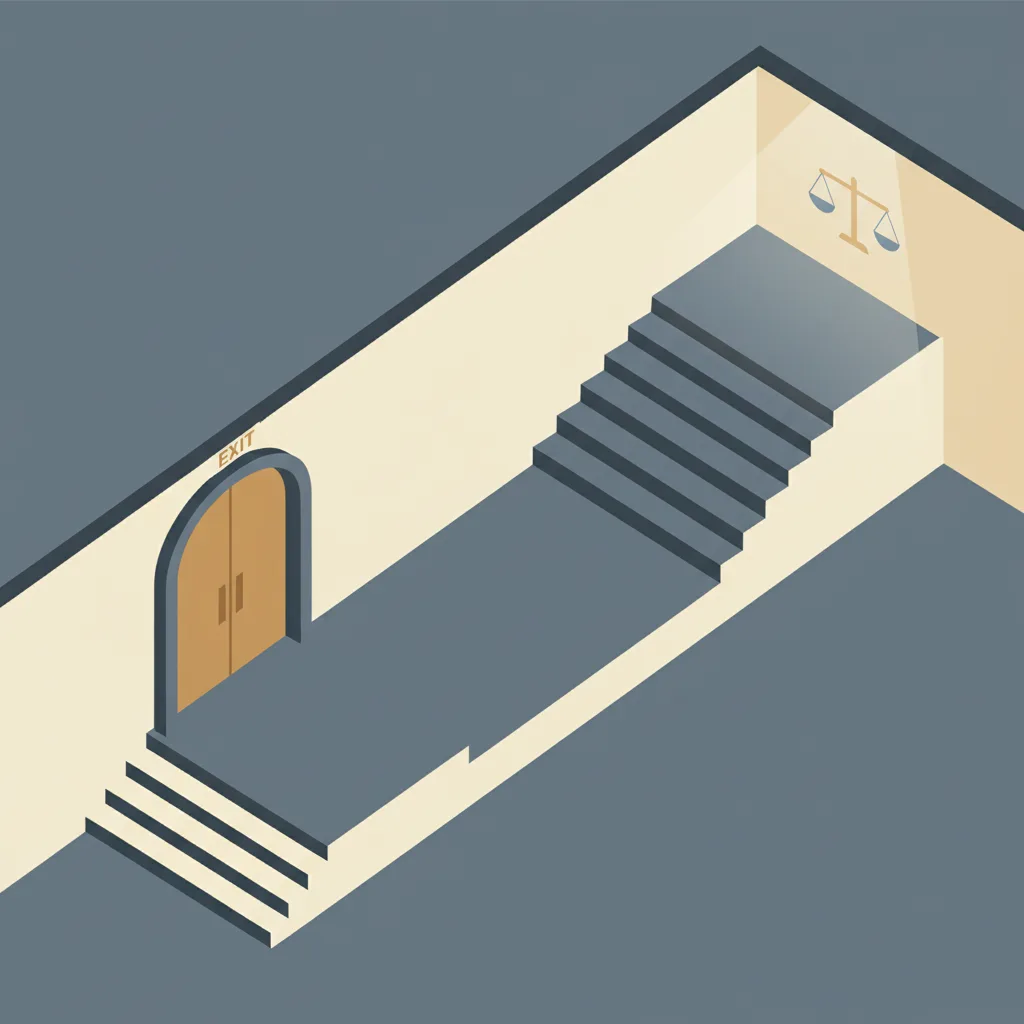
A courthouse with a split path: one leading upward to a higher court, the other leading back to a street-level exit.
代替データ — この決断に関する直接的な後悔調査は存在しません。比率は後悔を直接尋ねる質問ではなく、満足度スコアとアクセス障壁のデータから導出されています。以下の注意事項を参照してください。

行動への後悔

判決を不服として控訴する

86%

民事控訴の約70%が利益なしに費用を発生させ、第一審判決を支持する

控訴を提起する米国民事原告(USCourts.govデータ、争訟者調査)

控訴解決時間1-3年、2018-2023

不作為への後悔

控訴せず元の判決を受け入れる

60%

不利な判決を受け入れる人の約25%が、主に判決が不公正に見える場合に継続的な後悔を報告

控訴を提起しないことを選択した米国民事原告(争訟者調査、ABAデータ)

判決後2-5年の回顧的

この選択を後悔した割合

action dominates — 行動が優勢 — 多くは行動したことを後悔しています。

関連する決断

意味的に類似する決断 — 同じ領域、異なるトレードオフ。

金融

訴訟 vs. 和解

この選択を後悔した割合

不作為が優勢

不作為の後悔が1.5倍高い

金融

保険拒否への異議申し立て

この選択を後悔した割合

不作為が優勢

不作為の後悔が3.1倍高い

金融

自動車傷害請求のために弁護士を雇う

この選択を後悔した割合

行動が優勢

行動の後悔が2.2倍高い

金融

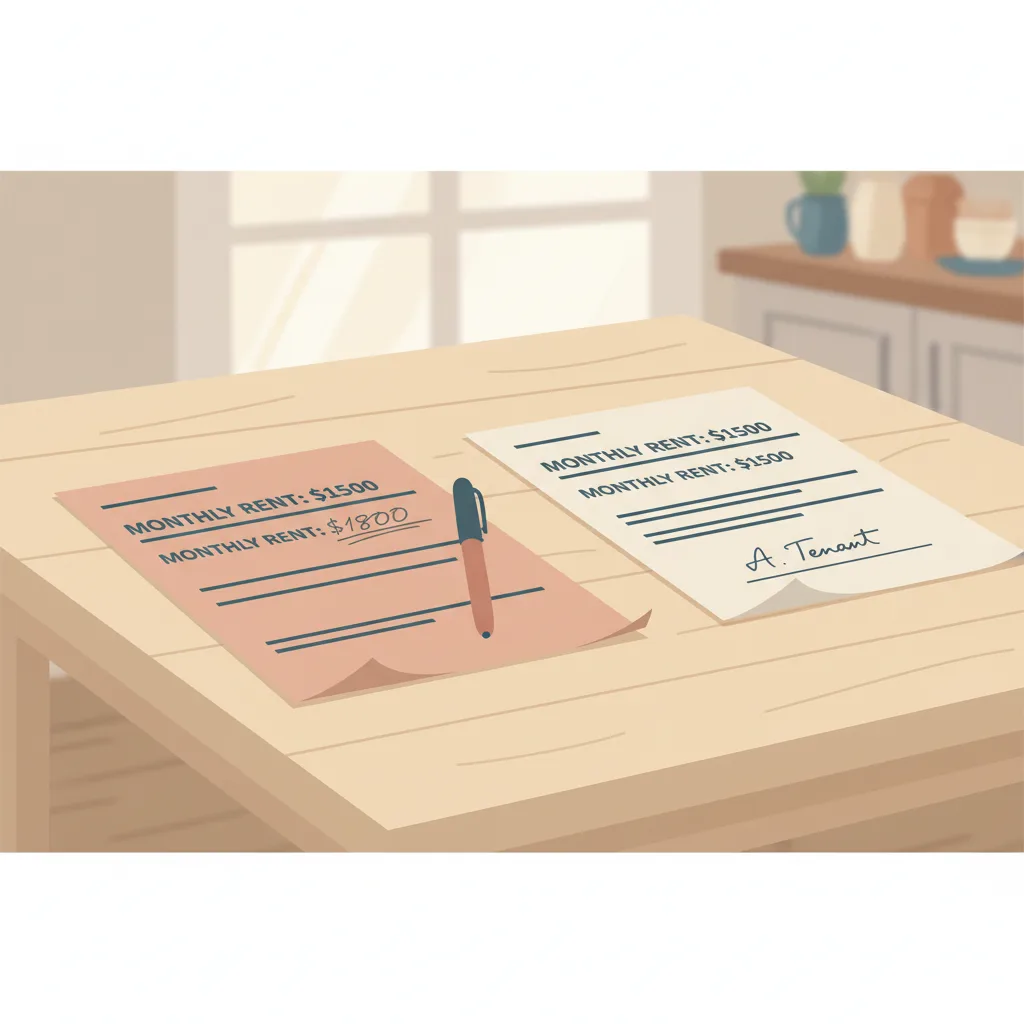
家賃交渉

この選択を後悔した割合

不作為が優勢

不作為の後悔が1.9倍高い

金融

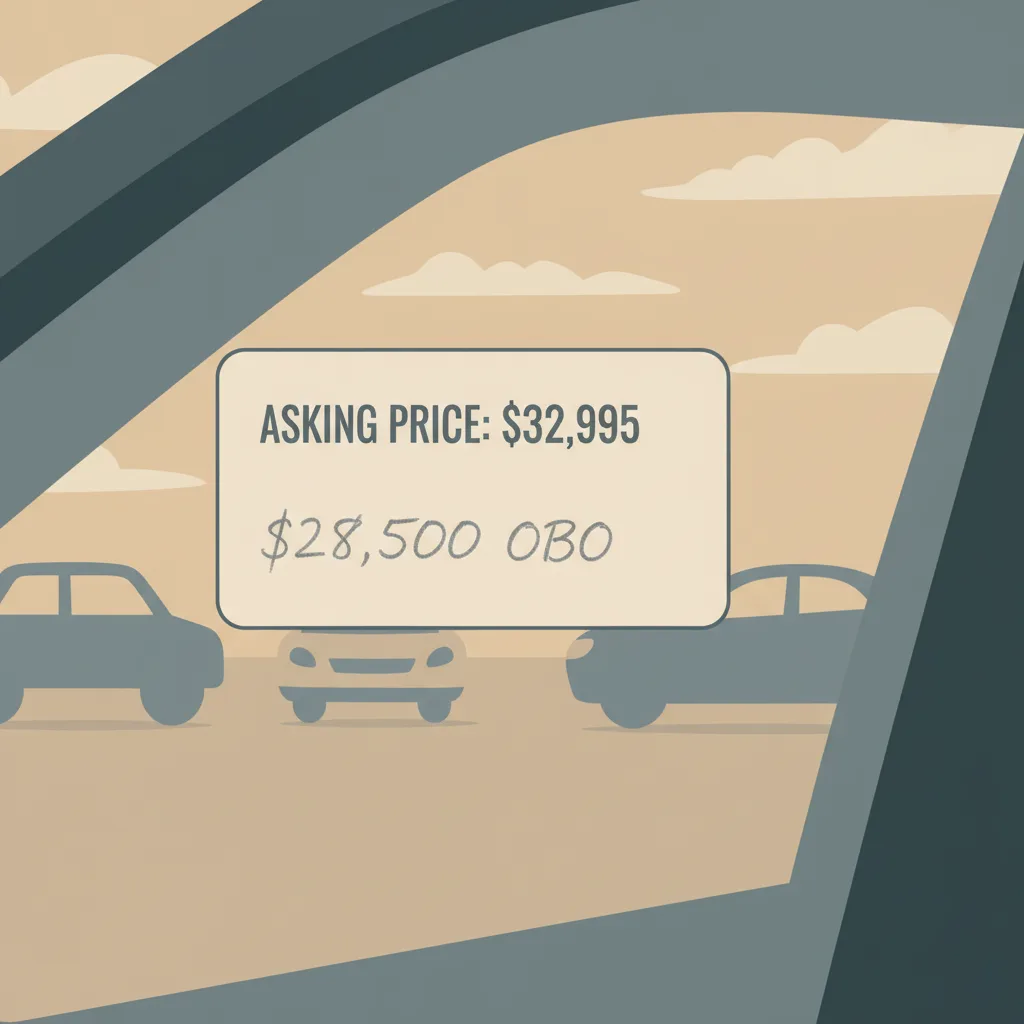
車の価格交渉

この選択を後悔した割合

不作為が優勢

不作為の後悔が1.6倍高い

金融

医療費の交渉

この選択を後悔した割合

不作為が優勢

不作為の後悔が7.6倍高い

金融

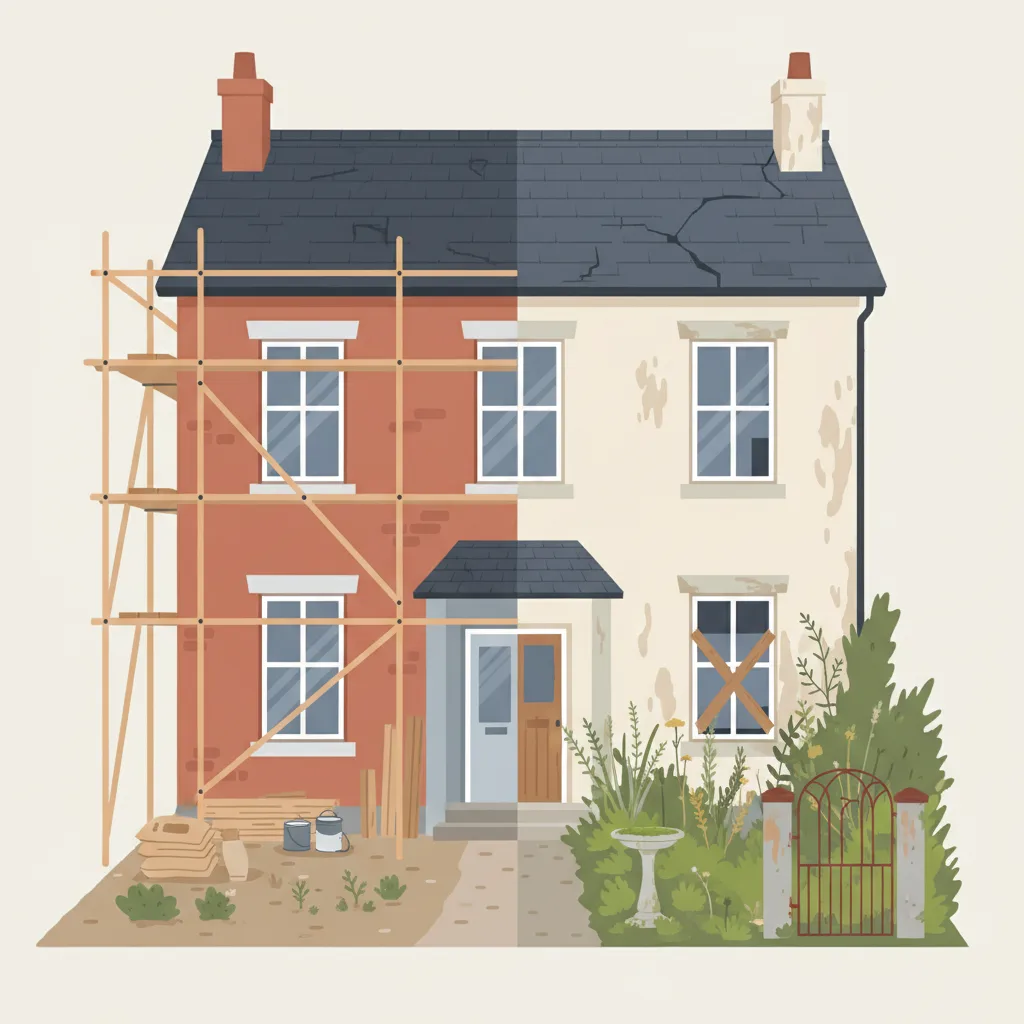
自宅リフォーム

この選択を後悔した割合

行動が優勢

行動の後悔が2.3倍高い

金融

家族への貸付

この選択を後悔した割合

行動が優勢

行動の後悔が1.3倍高い

Across all case types in US federal courts, roughly 86% of civil appellants do not achieve reversal of the lower court’s judgment — the figure is most favorable for private civil disputes (approximately 14% reversal rate), worse across the overall caseload (8.2%). Spending the time and money to appeal results in the original ruling standing in the vast majority of cases. On the inaction side, federal appellate-filing data suggests a majority of civil litigants who lose at trial never appeal at all: an analysis of federal civil cases found a 39.6% appeal rate among tried cases, implying that roughly 60% go uncontested — for some out of cost, lack of counsel, or low awareness of appellate rights, and for others because they correctly judge their odds of reversal are poor — leaving many with outcomes they believed were wrong but never contested.

The decision to appeal sits in a distinctive position among legal choices: it is almost always made after an already costly first proceeding, the odds are quantifiably long before the filing is made, and the costs of the action are immediate while potential benefits are speculative. Appeals courts are explicitly deferential to trial courts — the “any reasonable trier of fact” standard in civil cases means that many judgments that appear wrong to the losing party are legally unreviewable. The anti-plaintiff pattern in appellate outcomes shows up clearly in the available data: one Cornell Law/Journal of Empirical Legal Studies analysis found plaintiff appellants achieved reversal in about 4% of adverse trial judgments, versus about 10% for defendants — a pattern that analysis found held across case types — meaning individuals bringing claims may face steeper uphill odds than institutional defendants with experienced appellate counsel.

The regret calculus here is complicated by the multiple functions an appeal can serve. Some appellants file to force a settlement renegotiation, not because they expect to win at the appellate level — in those cases, even an unsuccessful appeal may achieve the desired outcome and generate no regret. The inaction side is equally ambiguous: many litigants who accept an adverse judgment have correctly assessed that their grounds for appeal are thin, and acceptance is a rational response rather than resigned defeat. The Gilovich temporal model predicts that regret about inaction grows over time — people who never fought a ruling they thought unjust may carry that grievance for years — while the disappointment of a failed appeal fades as appellants adapt to the outcome. The point estimates here are the weakest in this dataset and should be read as directional rather than quantitative.

出典: 行動

根拠台帳

以下の各数値は各出典が報告した内容であり、引用した原文の抜粋と算出方法を記載しています。リンクをクリックして直接確認できます。

  1. [1] Administrative Office of the U.S. Courts — Just the Facts: U.S. Courts of Appeals
    Just the Facts: U.S. Courts of Appeals
    統計値
    Fewer than 9% of total appeals in 2015 resulted in reversals; private civil cases saw the highest civil reversal rate at 14.2%
    抜粋
    “"Fewer than 9 percent of total appeals resulted in reversals of lower court decisions in 2015." [Paraphrase from the article's Table 2, a statistical table:] Bankruptcy appeals had the highest reversal rate of any category, at 24.4 percent. Among civil categories specifically, private civil cases had the highest reversal rate at 14.2 percent, followed by U.S. civil appeals at 4.2 percent. Prisoner petition appeals had a 4.6 percent reversal rate, and the overall reversal rate across all categories was 8.6 percent. ”
    出典データ
    2016-12-20
    アクセス日
    2026-07-07
    計算過程
    US Courts administrative data for 2015. The 14.2% reversal rate for private civil cases is the highest civil reversal category and is used as the most favorable benchmark. Under this rate, approximately 86% of private civil appellants do not obtain a reversal. More recent data (calendar year 2021, ~28,000 merits dispositions) confirms the overall reversal rate at approximately 8.2%, making the 14.2% for private civil cases an upper bound. The action regret proxy rate of 0.86 = 1 - 0.14 (using the most favorable category). It represents the share of appellants who spend money and time on appeal and do not achieve reversal. This is outcome inferiority rather than felt regret, but it is the closest available proxy.
  2. [2] Administrative Office of the U.S. Courts — Table B-5. U.S. Courts of Appeals—Decisions in Cases Terminated on the Merits (12-Month Period Ending December 31, 2021)
    Table B-5. U.S. Courts of Appeals—Decisions in Cases Terminated on the Merits (12-Month Period Ending December 31, 2021)
    統計値
    Of more than 28,000 cases terminated on the merits in the 12-month period ending December 31, 2021, about 2,300 resulted in reversal — an overall reversal rate of 8.2%
    抜粋
    “[Paraphrase from Table B-5, a statistical table.] Table B-5 reports "U.S. Courts of Appeals—Decisions in Cases Terminated on the Merits, by Nature of Proceeding—During the 12-Month Period Ending December 31, 2021." The total row shows roughly 28,000 cases decided on the merits with the reversed column totaling about 2,300 cases, yielding the "8.2" percent overall reversal rate reported in the table's reversed- percentage column. ”
    出典データ
    2021-12-31
    アクセス日
    2026-05-09
    計算過程
    2021 data from Table B-5 of the Statistical Tables for the Federal Judiciary (12-month period ending December 31, 2021). The 8.2% overall reversal rate (all case types, ~2,300 reversals out of ~28,000 merits terminations) confirms that most appeals fail. Private civil cases fare better than average (14.2% per 2015 data), so we use 14.2% as the reversal rate, giving an implied 85.8% non-reversal rate, rounded to 0.86 for the action regret proxy.

出典: 不作為

根拠台帳

以下の各数値は各出典が報告した内容であり、引用した原文の抜粋と算出方法を記載しています。リンクをクリックして直接確認できます。

  1. [1] Legal Services Corporation / NORC at the University of Chicago — The Justice Gap: The Unmet Civil Legal Needs of Low-Income Americans (2022)
    The Justice Gap: The Unmet Civil Legal Needs of Low-Income Americans (2022)

    See all 2 Likelier entries citing this source →

    統計値
    92% of civil legal problems of low-income Americans receive no or inadequate legal help; legal aid organizations must decline approximately half of all requests due to resource constraints
    抜粋
    “"For 92% of their substantial civil legal problems, low-income Americans do not get the legal help they need. Legal aid organizations receiving LSC funding must decline approximately half of all requests due to insufficient resources, leaving an estimated 1.4 million problems annually without adequate assistance." ”
    出典データ
    2022-04-01
    アクセス日
    2026-05-09
    計算過程
    Retained as background context only. This report documents severe access-to-justice constraints in US civil legal aid generally, but it contains no statistic on appeal rates or on litigants who forgo appealing a judgment specifically, so it is not used to derive the inaction-side regret_rate. It supports the qualitative point that cost barriers and lack of counsel are real and large, which may explain part of why civil litigants who lose at trial do not appeal — see the Eisenberg & Clermont source below for the actual regret_rate derivation.
  2. [2] Cornell Law School / Journal of Empirical Legal Studies — Appeal Rates and Outcomes in Tried and Nontried Cases: Further Exploration of Anti-Plaintiff Appellate Outcomes
    Appeal Rates and Outcomes in Tried and Nontried Cases: Further Exploration of Anti-Plaintiff Appellate Outcomes
    統計値
    The appeal rate is 39.6% in tried civil cases (versus 10.0% in nontried cases); the complement implies about 60% of tried-case losers do not appeal at all
    抜粋
    “"Federal data sets covering district court and appellate court civil cases for cases terminating in fiscal years 1988 through 2000 are analyzed. Appeals are filed in 10.9 percent of filed cases, and 21.0 percent of cases if one limits the sample to cases with a definitive judgment for plaintiff or defendant. The appeal rate is 39.6 percent in tried cases compared to 10.0 percent of nontried cases. Defendants achieve reversal of adverse trial court judgments in about 10 percent of filed cases and suffer affirmance in about 15 percent of such cases. Plaintiffs achieve reversal in about 4 percent of adverse trial court judgments and suffer affirmance in about 16 percent of such cases." ”
    出典データ
    2004-11-01
    アクセス日
    2026-07-07
    計算過程
    Eisenberg & Clermont's Cornell study of federal civil cases terminating FY1988-2000 (Journal of Empirical Legal Studies, 2004). The paper reports a 39.6% appeal rate in tried cases — cases that reached a trial-level judgment, matching this decision's "adverse judgment at trial" population. Because appeals are filed overwhelmingly by the losing or aggrieved side, this appeal rate is used as a proxy for the share of trial losers who contest the judgment; its complement, 1 - 0.396 = 0.604, rounded to 0.60, is the inaction-side regret proxy — the share who do not appeal at all. This replaces a prior "roughly one-third" estimate that this entry's own calculation_notes previously admitted had no traceable derivation from any cited source; that figure has been removed as unsupported. This remains a non-appeal rate, not a felt-regret rate — it does not separate rational acceptance (correctly assessed low odds, cost) from genuine regret, and the underlying data is federal, 1988-2000 vintage, not a current nationally representative sample. The reversal figures above (4% plaintiffs, ~10% defendants) corroborate the anti-plaintiff pattern discussed elsewhere in this entry but are not used in the regret_rate calculation.

注意事項

控訴での30%の成功率(したがって70%のアクション後悔)は米国の管轄区域全体の平均である;州裁判所の15%から専門控訴の40%まで変動する。70%は純粋な後悔を過大評価する:一部の控訴人は負けても控訴を原則の弁護と見なし、後悔しない。25%の非アクション後悔は民事紛争解決文献からの推定である;非アクション後悔は判決が手続き的または実質的に不公正に見える場合に高度に集中している。財政的計算は重要である:大きな紛争金額のケースでは、見逃したオプションが実質的に重要であったため非アクション後悔が高い;低価値のケースでは受け入れることはほとんど後悔をもたらさない。当事者タイプは重要である:自分を代表する控訴人(pro se)はずっと低い成功率(<15%)を持ち、アクション後悔をより重く評価すべきである。管轄区域は重要である:米国法は第一審判決への敬意を支持する;欧州大陸法システムでは控訴がより規範的で成功率が高い。

生データ: /api/decisions.json

このデバイスで最近見た項目