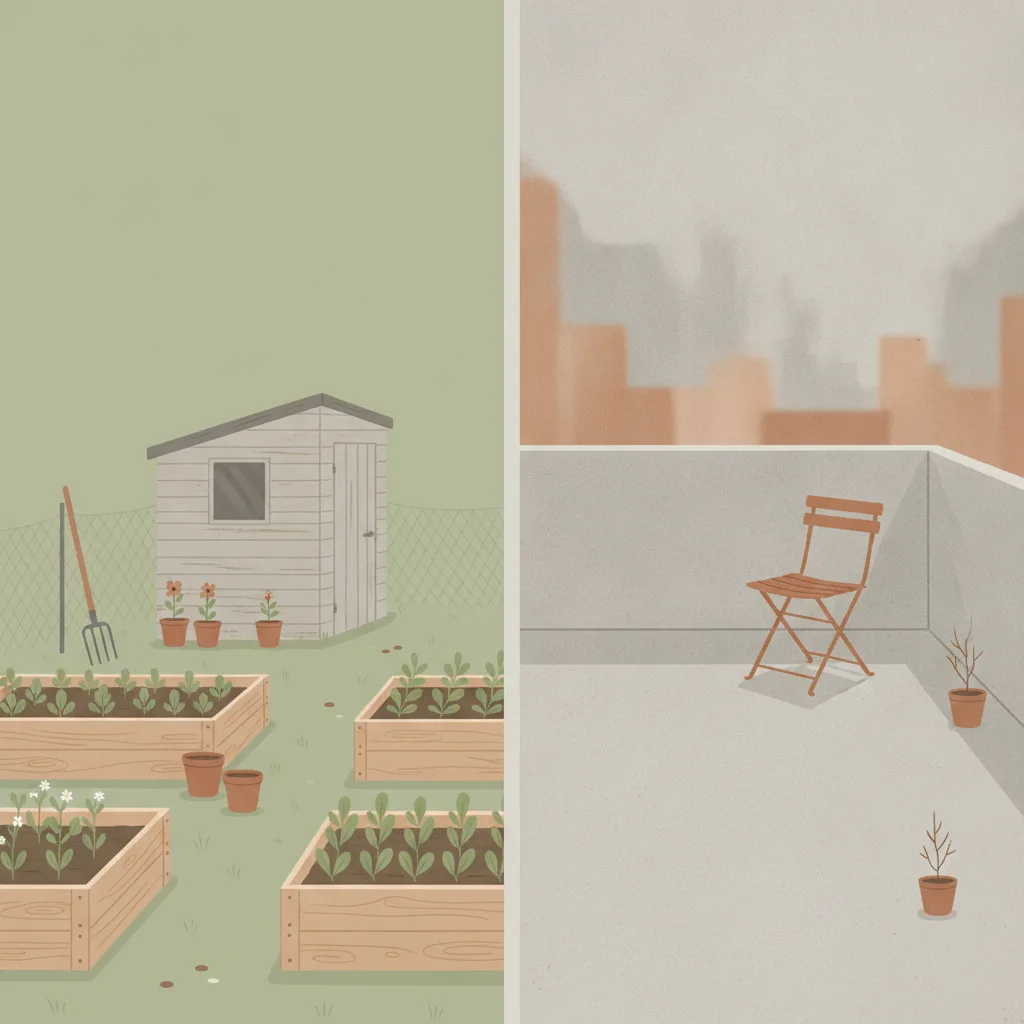
Een volkstuin of perceel in een gemeenschapstuin nemen vs. zonder blijven
Als je handelt
Een volkstuin of gemeenschappelijk tuinperceel nemen
8,0%
Als je niets doet
Zonder tuin of volkstuin blijven
38%
Minstens één cijfer is een indirecte schatting, geen gemeten percentage spijt. Hoe elk getal tot stand kwam, staat hieronder.
Levensstijl
Laatst beoordeeld 2026-05-04
Kwaliteit van bewijs 4.13/5
Beoordelingsscore op acht dimensies volgens de
kwaliteitsrubriek
. Elke dimensie krijgt een score van 1 tot 5.
D1 Bronverificatie
5/5
D2 Autoriteit en onafhankelijkheid van bronnen
4/5
D3 Nauwkeurigheid van spijtcijfer
2/5
D4 Vergelijkbaarheid van bronnen
3/5
D5 Gilovich-patroon
5/5
D6 Prozakwaliteit
5/5
D7 Volledigheid van voorbehouden
5/5
D8 Steekproefkwaliteit
4/5
Gemiddelde4.13/5
Indirecte gegevens: voor deze beslissing komt minstens één cijfer uit een indirecte maat, zoals gevolgen, tevredenheid of intentie, of uit een schatting van de redactie, en niet uit een enquête die rechtstreeks naar spijt vraagt. De toelichting bij elke kant hieronder legt uit hoe het getal tot stand kwam.
Als je handelt
Een volkstuin of gemeenschappelijk tuinperceel nemen
8,0%
91,9% van de volkstuinhouders beoordeelt het geestelijke-gezondheidsvoordeel van hun tuin als 8/10 of hoger (tevredenheidsproxy — er bestaat geen directe enquête over spijt of het opgeven van een tuin; de getoonde ~8% is het aandeel dat niet de topbeoordeling geeft, GEEN gemeten spijtpercentage)
Volkstuinhouders in Duitsland, VK, Nederland, VS
opgave na 2-3 jaar
Als je niets doet
Zonder tuin of volkstuin blijven
38%
~38% van de niet-tuinierders noemt gebrek aan toegang als reden dat ze niet tuinieren
Stedelijke volwassenen op wachtlijsten voor volkstuinen of zonder toegang tot tuinieren (VK, Duitsland, VS)
doorsnedeonderzoek, 2018-2023
Cijfer voor elke keuze (de maat staat op de pagina benoemd)
Een volkstuin of gemeenschappelijk tuinperceel nemenZonder tuin of volkstuin blijven
8,0%38%
Gerelateerde keuzes
Semantisch vergelijkbare keuzes — zelfde terrein, andere afwegingen.
Approximately 91.9% of UK allotment plot holders rate the mental health benefit
of their plot at 8 or higher out of 10, with 63% giving a perfect 10, according to
the National Allotment Society’s 2025 survey of approximately 2,000 holders. A 2010
peer-reviewed study in Environmental Health (van den Berg et al.) reached the same
figure independently: 91% of Dutch allotment gardeners reported increased happiness
after visiting their plot, and their life satisfaction scores were significantly
higher than those of matched non-gardening neighbors drawn from the same residential
areas (2.26 vs 2.12, p<0.05). Neither survey asked holders whether they regret
their plot; both measured benefit ratings, and in both the residual 8–9% is simply
the share who did not give the top positive response rather than a count of people
who wished they had not taken a plot. No published study reports a direct allotment
regret or relinquishment-due-to-regret rate, so the figure shown here is a
satisfaction-tail proxy, not a measured regret rate. The pattern
holds across age groups but is sharpest in older adults: among those over 62, the
Dutch gardeners scored 0.32 on a composite wellbeing index versus −0.26 for same-age
neighbors, and loneliness scores diverged by a factor of nearly three.
The inaction side is structured by access rather than preference. The RHS State of
Gardening 2025 found that 38% of UK adults who had not gardened in the past year
cited lack of access to growing space as the reason — the largest single barrier,
and one that implies desire without opportunity rather than chosen non-participation.
In the same RHS survey, 14.7 million adults said they would be interested in
volunteering for organised community gardening sessions, while 2.5 million had
taken part in community gardening initiatives over the past three years. Over
174,000 people are on UK waiting lists for allotment plots at any given time, with
average waits of four years nationally and up to twelve years in some London boroughs.
This is unusual among decisions studied here: the inaction group is partly
involuntary, shaped by land supply and local authority policy rather than freely
chosen preference. Whether one frames that constraint as regret or frustration, it
is directionally the same: a large population wants the outcome and does not have it.
The Gilovich inaction-dominance pattern is among the more robust in this dataset for
this topic, though both sides rest on proxies rather than direct regret questions.
The roughly 30-percentage-point gap between the action-side satisfaction-tail proxy
(~8% non-top rating) and the inaction-side access-barrier proxy (~38% cite lack of
access) is consistent across UK survey data and the Dutch controlled study, and
it is consistent with findings in adjacent decisions like gym membership and therapy
— categories where the barrier to starting tends to feel large and the regret after
starting tends to be low. The specific mechanism is well-documented: allotment
holders visit regularly (unlike vacation cabin owners), the costs are low relative to
perceived benefit, and the social dimension of a shared site appears to add value
that solo garden ownership does not. For those fortunate enough to reach the front
of a waiting list, the decision to take the plot is almost universally reported as
the right one.
Bronnen: handelen
Bronnenverantwoording
Elk getal hieronder is wat elke bron rapporteerde, met het letterlijke citaat waarop we ons baseerden en hoe we tot ons cijfer kwamen. Klik op een link om rechtstreeks te verifiëren.
2/2 bronnen onafhankelijk woordelijk geverifieerd tegenover de geciteerde bron
[1]National Allotment Society (via Pressat press office) — Growing the Evidence: Survey Shows the Power of Allotments
Geverifieerd
Gerenommeerde referentie
91.9% of UK allotment holders rate mental health benefits at 8/10 or higher; 63% give a perfect 10/10
Fragment
“"Nearly 63% of respondents rated the impact of their allotment on mental wellbeing a perfect 10, with 91.9% scoring it 8 or higher. Physical health benefits were similarly high, with 88.1% rating them 8 or above. 89.2% increased their fresh produce intake after getting a plot. 80.3% credited their plot with forming new social relationships."
”
Brongegevens van
2025-08-11
Geraadpleegd
2026-05-04
Verificatie
Fragment onafhankelijk opnieuw opgehaald en woord voor woord bevestigd tegenover de geciteerde bron tijdens onze onderbouwingsaudit.
Berekening
NAS 2025 survey of approximately 2,000 UK allotment plot holders. The survey measured benefit ratings, not regret: 91.9% rated the plot's mental-health benefit 8/10 or higher. The 8% stored as regret_rate is the arithmetic complement of that 91.9% (those who did NOT give a top-band rating), i.e. the satisfaction-score tail — NOT a dissatisfaction or regret rate. No question asked "do you regret getting an allotment", and no published survey measures allotment regret or relinquishment-due-to-regret (the 2024 Birmingham study of 876 tenants, Bloomfield, reports tenure — 9% held a plot <1 year, 36% 1–5 years — but no regret/quit rate; the 2025 APSE Local Authority State of the Market survey reports waiting-list demand, not plot abandonment). The non-top rating share is used only as the closest available proxy, with that limitation stated explicitly in the display and caveats. It is in the same range as the Netherlands peer-reviewed study (van den Berg et al. 2010), where 91% of allotment gardeners reported increased happiness after plot visits — again a positive-rating figure, not a measure of regret. The residual 8–9% in both samples is the share who did not give the top positive response, not a count of people who wished they had not taken a plot.
Onafhankelijkheid
NAS is an independent UK charity that represents allotment holders. This survey is independent of the RHS, van den Berg academic study, and any commercial or government source.
[2]Environmental Health (BioMed Central / Springer) — Allotment gardening and health: a comparative survey among allotment gardeners and their neighbors without an allotment
Geverifieerd
Vakgenoten-beoordeeld
91% of allotment gardeners reported increased happiness after plot visits; life satisfaction 2.26 vs 2.12 for non-gardening neighbors (p<0.05)
Fragment
“"Eighty-four percent reported feeling healthier after a visit to the allotment garden. [...] 91 percent reported feeling happier and 86 percent reported feeling less stressed."
”
Brongegevens van
2010-10-27
Geraadpleegd
2026-05-04
Verificatie
Fragment onafhankelijk opnieuw opgehaald en woord voor woord bevestigd tegenover de geciteerde bron tijdens onze onderbouwingsaudit.
Berekening
van den Berg et al. (2010) surveyed 121 allotment gardeners and 63 matched non-allotment neighbors recruited from the same residential areas near 12 allotment sites in 8 Dutch cities (July–September sampling). Both groups completed the same wellbeing questionnaire, providing a genuine comparison of people who garden vs. comparable people who do not. The 91% happiness increase rate among gardeners implies approximately 9% who did not report this outcome — consistent with the NAS 2025 UK figure. Used here as the independent peer-reviewed anchor corroborating the NAS satisfaction finding.
Onafhankelijkheid
Independent of all other sources: peer-reviewed academic study published in a Springer/BioMed Central journal, conducted by Dutch university researchers (Wageningen UR), using a controlled matched-sample design rather than a self-selected holder survey. Different country (Netherlands), different year (2010), different methodology.
Bronnen: niet handelen
Bronnenverantwoording
Elk getal hieronder is wat elke bron rapporteerde, met het letterlijke citaat waarop we ons baseerden en hoe we tot ons cijfer kwamen. Klik op een link om rechtstreeks te verifiëren.
1/2 bronnen onafhankelijk woordelijk geverifieerd tegenover de geciteerde bron
[1]Royal Horticultural Society — RHS State of Gardening Report 2025
Gerenommeerde referentie
38% of non-gardeners cite lack of access to indoor or outdoor growing space as the reason they do not garden; 8.5 million people have never gardened, many of whom lack access to suitable space
Fragment
“"Notably, 38% of non-gardeners had no space in which to garden. [...] 2.5m people took part in community gardening initiatives over the past three years [...] yet 8.5 million people have never gardened [...] 14.7 million adults said they would be interested in volunteering for organised community gardening sessions."
”
Brongegevens van
2025-01-01
Geraadpleegd
2026-05-04
Berekening
RHS State of Gardening is the annual national survey of UK gardening participation and barriers. The 38% access-barrier figure measures the share of recent non-gardeners who attribute their non-participation to lacking space rather than lacking interest — i.e., they want to garden but cannot. This is a proxy for inaction regret: access-deprived non-gardeners represent a population that wants the outcome (a plot) but does not have it. The 14.7 million figure counts adults interested in volunteering for organised community gardening sessions; it measures interest in volunteering, not a wish for a plot, and is only a rough population-level scale check. METHODOLOGICAL CAVEAT: "cites access as the barrier" is not the same as "regrets not having a plot" — the 38% is the best available proxy, not a direct regret measurement. The waiting list data (174,000+ on UK allotment lists, average wait 4 years) corroborates the scale of unmet demand.
Onafhankelijkheid
The RHS is the UK's leading horticultural charity, independent of the NAS and of the van den Berg academic research. The RHS State of Gardening surveys general UK adults, not specifically allotment holders, making it methodologically complementary to the NAS holder-only survey.
[2]Environmental Health (BioMed Central / Springer) — Allotment gardening and health: a comparative survey among allotment gardeners and their neighbors without an allotment
Geverifieerd
Vakgenoten-beoordeeld
Non-allotment neighbors scored significantly lower on life satisfaction (2.12 vs 2.26, p<0.05) and loneliness (aged 62+: 0.80 vs 0.28) compared to allotment gardeners in the same residential areas
Fragment
“"84 percent of the allotment gardeners met the Dutch guideline [...] this norm was met by only 62 percent of the respondents in the control group."
”
Brongegevens van
2010-10-27
Geraadpleegd
2026-05-04
Verificatie
Fragment onafhankelijk opnieuw opgehaald en woord voor woord bevestigd tegenover de geciteerde bron tijdens onze onderbouwingsaudit.
Berekening
The non-gardening neighbor group in van den Berg et al. (2010) represents the inaction side: people living near allotments who do not garden. Their measurably lower life satisfaction (p<0.05) and higher loneliness scores provide peer-reviewed evidence that the non-gardening state is associated with worse wellbeing outcomes than the gardening state. This is a wellbeing gap, not a direct regret measurement, but it is the strongest controlled evidence available for the cost of the inaction choice. Used here as the independent corroborating anchor for the RHS access-barrier finding.
Onafhankelijkheid
Same study as cited on the action side; used here as the inaction-side comparison group. The neighbor group (n=63) and gardener group (n=121) were both recruited from the same residential areas, providing the closest available controlled comparison.
Kanttekeningen
PROXY-METINGEN — GEEN VAN BEIDE ZIJDEN GEBRUIKT EEN DIRECTE SPIJTVRAAG. Geen enkele gepubliceerde enquête of studie in de volkstuinliteratuur vraagt houders rechtstreeks of ze spijt hebben van het nemen van een tuin, of niet-houders of ze spijt hebben dat ze er geen hebben. Het actiepercentage van 8% is het complement van de tevredenheidsscore van 91,9% (NAS 2025) — een tevredenheidsinversie, geen spijtmeting. Het inactiepercentage van 38% is het toegangsbarrière-aandeel aan de rechterzijde — "noemt toegang als reden dat ik niet tuinier" ≠ "heeft spijt dat ik geen tuin heb". Beide zijn de best beschikbare proxies; er bestaan geen betere gegevens in de gepubliceerde literatuur. SURVIVORSHIP- / ATTRITIEBIAS: De NAS 2025-enquête omvat alleen huidige tuinhouders. Mensen die een tuin verwierven, deze onbevredigend of te veeleisend vonden en deze opgaven, zijn niet vertegenwoordigd — hun uitsluiting betekent dat het werkelijke aandeel van ooit-houders die de keuze niet zouden herhalen vrijwel zeker hoger is dan het hier getoonde residu van 8% dat niet de topbeoordeling gaf, wat een tevredenheidsstaart-proxy is en geen gemeten spijtpercentage. INFLATIE DOOR SOCIALE WENSELIJKHEID: Volkstuinieren draagt in het VK een sterk positieve culturele lading (gezondheid, gemeenschap, duurzaamheid). Zelfgerapporteerde tevredenheidsscores worden waarschijnlijk opgeblazen door sociale wenselijkheidseffecten; houders kunnen ontevredenheid onderrapporteren, zelfs bij een anonieme enquête. KLEINE VERGELIJKINGSGROEP: De door vakgenoten beoordeelde bilaterale vergelijking van van den Berg (2010) — het sterkste gecontroleerde bewijs in dit item — gebruikt slechts n=63 niet-tuinierende buren naast n=121 volkstuinierders. Bij deze steekproefomvang is de kloof in levenstevredenheid (2,26 vs 2,12, p<0,05) statistisch significant, maar het betrouwbaarheidsinterval is breed; de effectgrootte moet als richtinggevend in plaats van precies worden behandeld. POPULATIEBEREIK: Alle cijfers zijn Brits/Europees; de Amerikaanse buurttuincultuur is minder verankerd, wachtlijsten zijn korter en de normen rond tuintermijnen verschillen — directe overzetting van percentages is niet gepast. TOEGANGSBEPERKINGEN OP INACTIE: In tegenstelling tot de meeste beslissingen in deze dataset is de inactiekeuze vaak onvrijwillig — 174.000+ mensen staan op Britse wachtlijsten met gemiddelde wachttijden van 4 jaar en tot 12 jaar in sommige Londense boroughs. Een deel van de "inactie"-groep zou handelen als het aanbod dit toeliet, wat het Gilovich-kader compliceert dat ervan uitgaat dat inactie vrij werd gekozen.