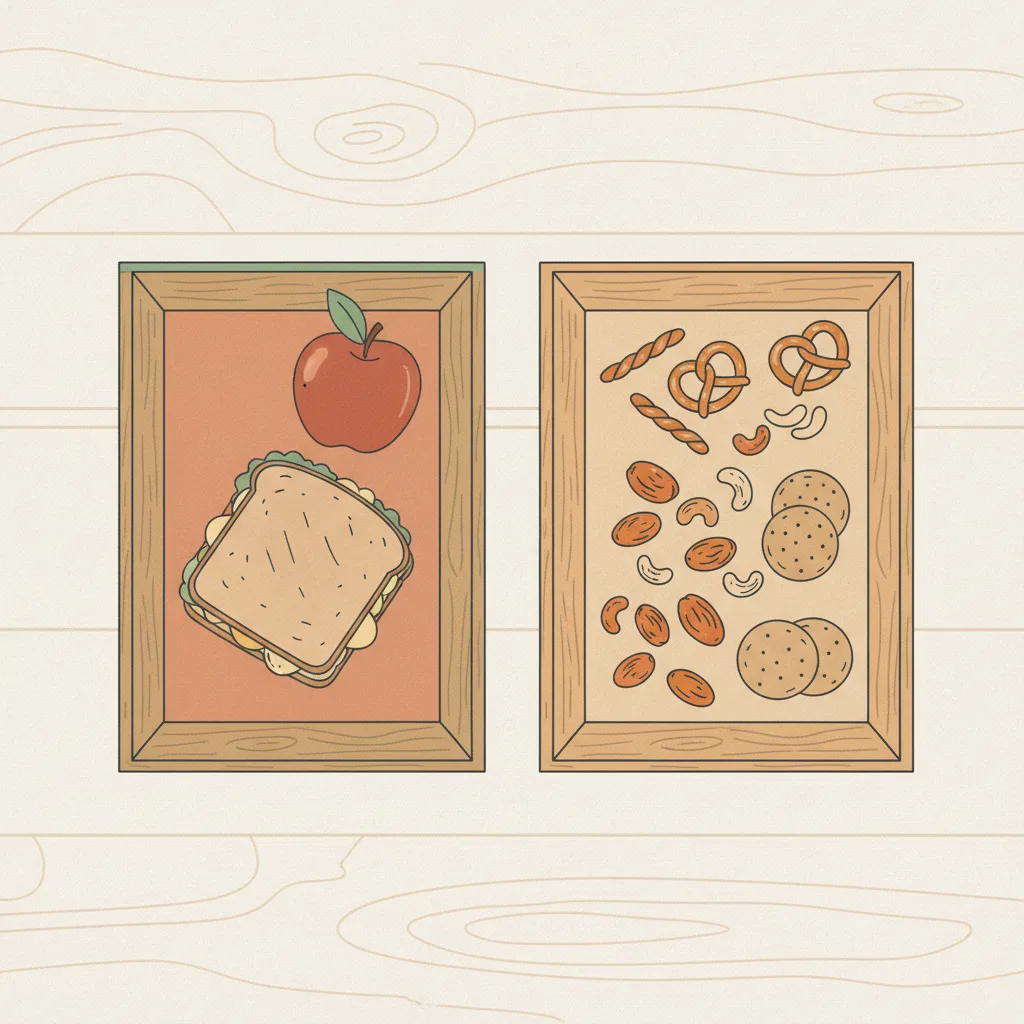
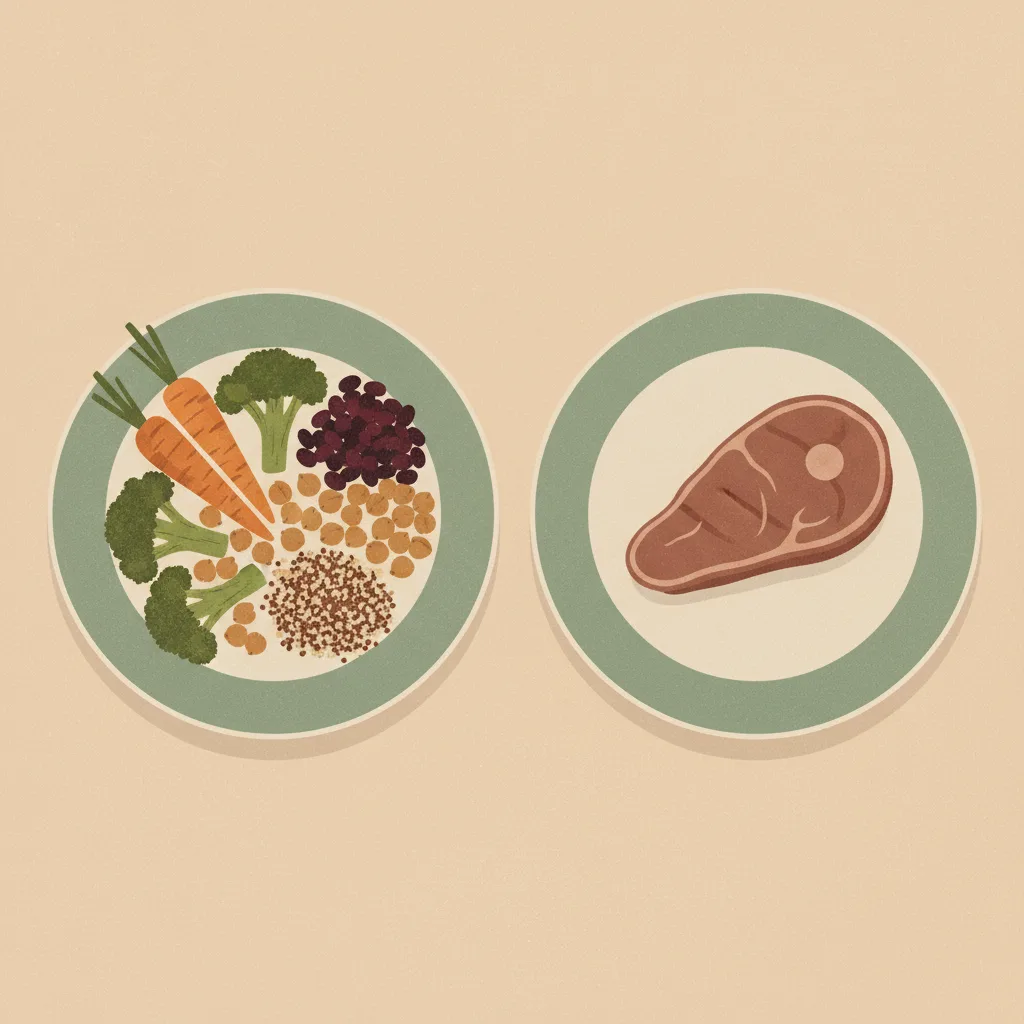
Spuntini tra i pasti (pattern moderno di pascolo) rispetto al mangiare solo a 2-3 pasti definiti senza spuntini
Se agisci
Spuntini tra i pasti
15%
Se non agisci
Mangiare solo a 2-3 pasti definiti (senza spuntini)
27%
Percentuale di chi poi rimpiange ciascuna scelta. Le barre e il registro completo dei dati compaiono sotto.
Stile di vita
Ultima revisione 2026-05-30
Qualità delle prove 3.75/5
Punteggio di revisione su otto dimensioni rispetto alla
griglia di qualità
. Ogni dimensione valutata da 1 a 5.
D1 Verifica delle fonti
4/5
D2 Autorità e indipendenza delle fonti
5/5
D3 Precisione del tasso di rimpianto
2/5
D4 Comparabilità delle fonti
4/5
D5 Schema di Gilovich
3/5
D6 Qualità della prosa
4/5
D7 Completezza degli avvertimenti
3/5
D8 Qualità del campione
5/5
Media3.75/5
Dati proxy — non esiste alcun sondaggio diretto sul rimpianto per questa decisione. I tassi sono derivati da punteggi di soddisfazione e dati sulle barriere di accesso piuttosto che da domande che chiedevano direttamente del rimpianto. Vedi avvertenze di seguito.
Rimpianto per azione
Spuntini tra i pasti
15%
~15% degli adulti statunitensi si pone un proposito di Capodanno mirato a ridurre gli spuntini/i cibi zuccherati (quota specifica agli spuntini del dato Purdue del 25% relativo a qualsiasi proposito alimentare — intenzione dichiarata prospettica, non rimpianto retrospettivo)
Adulti statunitensi, rappresentativi a livello nazionale
trasversale, condotto a gennaio 2024
Rimpianto per inazione
Mangiare solo a 2-3 pasti definiti (senza spuntini)
27%
Il 27% degli adulti statunitensi sta attivamente cercando di perdere peso (proxy di intenzione di gestione del peso — non un rimpianto diretto per lo schema a soli pasti)
Adulti statunitensi, rappresentativi a livello nazionale
trasversale, condotto dal 6 al 20 novembre 2024
% rimpiange questa scelta
Spuntini tra i pastiMangiare solo a 2-3 pasti definiti (senza spuntini)
15%27%
inaction dominates — L'inazione domina — la maggior parte si pente di non aver agito.
Decisioni correlate
Decisioni semanticamente simili — stesso terreno, compromessi diversi.
Perseguire attivamente la longevità (digiuno, integratori, biohacking)Accettare l'invecchiamento standard (no biohacking, assistenza medica convenzionale)
Twenty-seven percent of US adults are actively working to lose
weight, per Gallup’s November 2024 national poll of 1,001 adults
— the closest available proxy for dissatisfaction with eating patterns
that might motivate adopting a meals-only structure. That figure is
the inaction-side proxy shown above. It falls short of a direct regret
measure: the meals-only pattern is the minority position in the US,
so the question “do you regret not snacking?” is structurally rare,
and most adults who restrict to defined meals do so deliberately as
a weight-management or blood-sugar strategy rather than as a
regret-driven reversal of a prior snacking habit.
On the other side, 25% of US consumers set a food or nutrition-
related New Year’s resolution in 2024, per Purdue’s Consumer Food
Insights survey of 1,200 US adults — up six percentage points from
2023, with “the majority” planning to limit salty snacks, sugary
foods, regular soft drinks and alcohol. That 25% spans many dietary
goals, not snacking, so the action-side proxy is the snacking-specific
slice: roughly 13-18% of all US adults if “the majority” means about
half to two-thirds of those with resolutions, which we set at ~15%.
Even that ~15% is prospective intent to cut snacks, not retrospective
regret about a snacking habit. The structural
backdrop: USDA NHANES 2017-March 2020 data show 95% of US adults
snack on a given day, 78% snack multiple times, and among consumers
snacks contribute 24% of daily energy and 43% of added sugars. The
two figures come from different instruments (Purdue resolution
intent vs Gallup active weight-management) and measure different
constructs (prospective resolution vs current effort), so any
cross-side comparison is approximate.
The meal-frequency question is genuinely contested in the nutrition
literature. Bellisle’s 2014 Physiology & Behavior review concludes
that snacking neither clearly causes obesity nor clearly prevents
it, that eating frequency does not independently predict body weight
when total energy intake is controlled, and that the same eating
pattern can have different effects depending on food quality and
context. That weakens the case for either side carrying strong
regret: most US adults snack, most US adults who snack are not
measurably worse off for it when energy intake is matched, and the
few who reverse to a meals-only pattern do not have unambiguous
evidence that their previous behavior caused them measurable harm.
The ~12-point gap between the ~15% snacking-resolution share and the
27% active weight-management share is a difference between two weak,
non-comparable proxy instruments, not a measured difference in
regret. Readers should treat both figures as proxies for different
constructs and not read the delta as a precise regret comparison.
Fonti: azione
Registro delle fonti
Ogni numero qui sotto è ciò che ciascuna fonte ha riportato, con la citazione testuale su cui ci siamo basati e come siamo arrivati alla nostra cifra. Clicca su qualsiasi link per verificare direttamente.
1/3 fonti verificate in modo indipendente e alla lettera rispetto alla fonte citata
[1]News-Medical / coverage of Purdue Consumer Food Insights Jan 2024 — Increasing New Year's resolutions for healthier eating, Purdue report finds
Fonte di riferimento
25% of US consumers had a food/nutrition-related New Year's resolution in 2024 (up 6 pp from 2023); the majority plan to increase fruits, vegetables and water while limiting salty snacks, sugary foods, regular soft drinks and alcohol; 46% anticipate cravings as an obstacle
Estratto
“"25% of consumers responded 'yes' when asked if they had any food or nutrition-related New Year's resolutions, up 6 percentage points from the response to the same question last year... the survey-based report out of Purdue University's Center for Food Demand Analysis and Sustainability...included 1,200 consumers across the U.S."
”
Dati originali da
2024-02-15
Consultato
2026-05-30
Calcolo
Purdue Center for Food Demand Analysis and Sustainability, Consumer Food Insights, Volume 3 Issue 1, January 2024, N=1,200 US consumers. The 25% headline is the share of US consumers with ANY food/nutrition-related New Year's resolution, covering many dietary goals (more fruit/veg/water, less salty snacks, sugary foods, soft drinks, alcohol) — it is NOT a snacking-specific figure and NOT a regret measure. Because the report says \"the majority\" of those resolutions target the salty-snacks/sugary-foods/soft-drinks/alcohol basket (not snacking alone), the snacking-targeted share is roughly 0.25 x ~50-70% = 13-18% of all US adults. We therefore set the action-side proxy to the midpoint, ~15% (regret_rate 0.15), and label it explicitly as prospective resolution intent to cut snacks/sugary foods, not retrospective regret about snacking. The earlier 25% figure fused the all-resolutions headline with a snacking claim and overstated the snacking-targeted signal; this has been corrected.
Indipendenza
Independent academic survey from Purdue's Center for Food Demand Analysis and Sustainability with publicly disclosed methodology; no commercial sponsorship of the consumer insights series.
[2]USDA Agricultural Research Service / Sebastian, Hoy, Goldman, Moshfegh — Snack Consumption by U.S. Adults: What We Eat in America, NHANES 2017 - March 2020
Rapporto governativo
95% of US adults aged 20+ consume one or more foods or beverages as a snack on the intake day; 78% consume two or more snacks; snacks provide on average 24% of daily energy and 43% of added sugars among consumers
Estratto
“"Among adults aged 20 years and older, 95% consume one or more foods and/or beverages at a snack on the intake day... Currently, consuming multiple snacks is the norm, with 78% consuming two or more on any given day. Among consumers, snacks provide on average 24% of daily intake of energy and 43% of added sugars."
”
Dati originali da
2024-04-01
Consultato
2026-05-30
Calcolo
USDA Dietary Data Brief No. 53, based on NHANES 2017-March 2020 nationally representative dietary recall data. Establishes the prevalence baseline: 95% of US adults snack at least once on a given day; 78% snack multiple times; snacks contribute 24% of daily energy and 43% of added sugars on average. Used here on the action side as the govt_report context: snacking is the normal modern US eating pattern, not a deviation. This is NOT the regret-rate figure; that is from Purdue Jan 2024 (see above). The NHANES data establishes that the question \"do you regret snacking?\" applies to nearly all US adults if at all, and that the dietary stakes (43% of added sugars from snacks among consumers) are concrete.
Indipendenza
US federal government data (NHANES via USDA ARS) with publicly disclosed methodology; no commercial sponsorship of the survey or analysis. Independent of the Purdue insights series.
[3]Journal of Nutrition / Piernas & Popkin — Snacking Increased among U.S. Adults between 1977 and 2006
Verificato
Articolo peer-reviewed
US adult snacking prevalence increased from 71% to 97% between 1977-78 and 2003-06; contribution of snacks to total energy intake increased from 18% to 24%
Estratto
“"snacking prevalence increased significantly from 71 to 97% in 2003-2006... the percentage of snacking on both d 1 and d 2 increased from 42 to 78%... the contribution of snacks to total energy intake increased from 18 to 24%."
”
Dati originali da
2010-02-01
Consultato
2026-05-30
Verifica
Estratto recuperato in modo indipendente e confermato parola per parola rispetto alla fonte citata durante il nostro audit di attendibilità.
Calcolo
Piernas & Popkin (J Nutr 2010) established the long-run shift: US adult snacking went from a minority behavior (71% on any given day in 1977-78) to near-universal (97% by 2003-06), with the share of daily energy from snacks rising from 18% to 24%. Used on the action side as the peer-reviewed historical baseline for the prevalence claim above. This is NOT the action-side regret-rate figure; that is the snacking-specific share (~15%) derived from Purdue's January 2024 resolution survey (see above). Snacking-related regret has not been directly surveyed in the US, so the action side relies on a prospective resolution-intent proxy, not a retrospective regret measure.
Indipendenza
Independent academic analysis of CDC NHANES data; methodology publicly disclosed. No commercial sponsorship of the analysis.
Fonti: inazione
Registro delle fonti
Ogni numero qui sotto è ciò che ciascuna fonte ha riportato, con la citazione testuale su cui ci siamo basati e come siamo arrivati alla nostra cifra. Clicca su qualsiasi link per verificare direttamente.
2/2 fonti verificate in modo indipendente e alla lettera rispetto alla fonte citata
[1]Gallup News — 43% of Americans Say They Are Overweight; 55% Want to Slim Down
Verificato
↗ 1 other entry
Fonte di riferimento
27% of US adults are actively working to lose weight; 55% want to lose weight; 43% view themselves as overweight
Estratto
“"43%, view themselves as overweight... 55%, say they want to lose weight... only 27% report they are actively working toward that goal."
”
Dati originali da
2024-12-10
Consultato
2026-05-30
Verifica
Estratto recuperato in modo indipendente e confermato parola per parola rispetto alla fonte citata durante il nostro audit di attendibilità.
Calcolo
Gallup national poll, N=1,001 US adults, fielded November 6-20, 2024, margin of error ±4 percentage points. Used here as the inaction-side proxy: 27% of US adults are actively pursuing weight management, a state that implies current dissatisfaction with some aspect of current eating behavior including the absence of structural snacking discipline. This is NOT a direct regret measure about the meals-only pattern; in fact, the meals-only pattern is the minority position (95% of US adults snack daily per NHANES), so the question \"do you regret not snacking?\" is structurally rare. The 27% captures the directional signal: a substantial minority of US adults are actively dissatisfied enough with their current diet to do something about it, and \"cut the snacks\" is one of the most common dietary-change targets in popular guidance.
Indipendenza
Independent Gallup national poll using random-digit-dial methodology; no shared sample with USDA NHANES or Piernas & Popkin. Different methodology and different construct.
[2]Physiology & Behavior / France Bellisle — Meals and snacking, diet quality and energy balance
Verificato
Articolo peer-reviewed
Snacking may contribute to excess energy intake and weight gain via context, frequency and food quality; in some reports snacking facilitates energy-intake adjustment to needs, in others (especially obese populations) it contributes energy but little nutrition
Estratto
“"Snacking may contribute to excess energy intake and weight gain through different ways, for example: context/environment of eating, frequency of consumption and quality of food choices. In many reports, snacking appears to facilitate the adjustment of energy intake to needs, and to contribute carbohydrates, rather than fats, to the diet. By contrast, snacking often appears to contribute much energy but little nutrition in the diet of other consumers, particularly obese children and adults."
”
Dati originali da
2014-07-01
Consultato
2026-05-30
Verifica
Estratto recuperato in modo indipendente e confermato parola per parola rispetto alla fonte citata durante il nostro audit di attendibilità.
Calcolo
Bellisle (Physiology & Behavior 2014) is the canonical peer- reviewed review framing the meal-frequency literature. The critical finding: eating frequency does not independently predict body weight when total energy intake is controlled. Used here on the inaction side as the literature basis for the observation that the case for a meals-only pattern is genuinely contested — snacking neither clearly causes obesity nor clearly prevents it, and the same eating pattern can have different effects depending on food quality and context. This is NOT the regret rate; that is from Gallup 2024. Bellisle's review provides the scientific context that weakens the case for the inaction side carrying strong regret: most US adults snack, most US adults who snack are not measurably worse off for it when energy intake is matched, and the few who reverse to a meals-only pattern do not have unambiguous evidence that their previous behavior was harmful.
Indipendenza
Independent peer-reviewed academic review with publicly disclosed methodology; Bellisle has published widely on eating frequency, including some industry-funded studies on snacking listed in her overall body of work but the 2014 P&B review is not directly industry-sponsored.
Avvertenze
Nessuno dei due lati misura direttamente il rimpianto, e nessun sondaggio statunitense pubblicato chiede frontalmente "rimpiangi di fare spuntini tra i pasti?" oppure "rimpiangi di non fare spuntini?". La questione della frequenza dei pasti è genuinamente controversa nella letteratura nutrizionale (Bellisle 2014, Physiol Behav): la frequenza dei pasti non predice in modo indipendente il peso corporeo quando si controlla l'apporto energetico totale. Il sondaggio Purdue Consumer Food Insights del gennaio 2024 ha rilevato che il 25% dei consumatori statunitensi ha QUALSIASI proposito di Capodanno alimentare/nutrizionale; quel 25% abbraccia molti obiettivi dietetici, non gli spuntini. Poiché "la maggioranza" di quei propositi mira al paniere di snack salati/cibi zuccherati/bibite/alcol, la quota specifica agli spuntini è all'incirca il 13-18% di tutti gli adulti statunitensi, quindi fissiamo il proxy del lato azione al punto medio, ~15%. (Una versione precedente usava il 25% pieno, che fondeva il titolo relativo a tutti i propositi con un'affermazione sugli spuntini e sovrastimava il segnale d'azione.) Anche al 15% si tratta di intenzione di proposito prospettica, non di rimpianto retrospettivo sugli spuntini. Il 27% del lato inazione è la quota Gallup del novembre 2024 di adulti statunitensi che stanno attivamente cercando di perdere peso — un segnale correlato ma indiretto, e lo schema a soli pasti è di per sé la posizione minoritaria negli Stati Uniti (il 95% degli adulti statunitensi fa spuntini ogni giorno secondo USDA NHANES 2017-marzo 2020), quindi la domanda "rimpiangi di non fare spuntini?" è strutturalmente rara. Usiamo il 27% dello sforzo attivo di perdita di peso come proxy adiacente al rimpianto più vicino disponibile. I due dati provengono da strumenti e popolazioni diversi (sondaggio Purdue sull'intenzione di proposito vs sondaggio Gallup sulla gestione attiva del peso) e misurano costrutti diversi (proposito prospettico vs sforzo attuale), quindi qualsiasi confronto tra i due lati è approssimativo e non va letto come un divario di rimpianto preciso. Il regret_delta di ~12 punti riflette due strumenti proxy non comparabili, non una differenza misurata nel rimpianto. Alla base della questione del rimpianto c'è la causalità controversa: i dati NHANES mostrano che gli spuntini contribuiscono al 24% dell'energia giornaliera e al 43% degli zuccheri aggiunti tra i consumatori, il che stabilisce lo schema degli spuntini come un contributore importante all'apporto calorico povero di nutrienti, ma la rassegna di Bellisle sostiene che la dimensione della frequenza dei pasti è in gran parte subordinata all'apporto energetico totale e alla qualità del cibo.