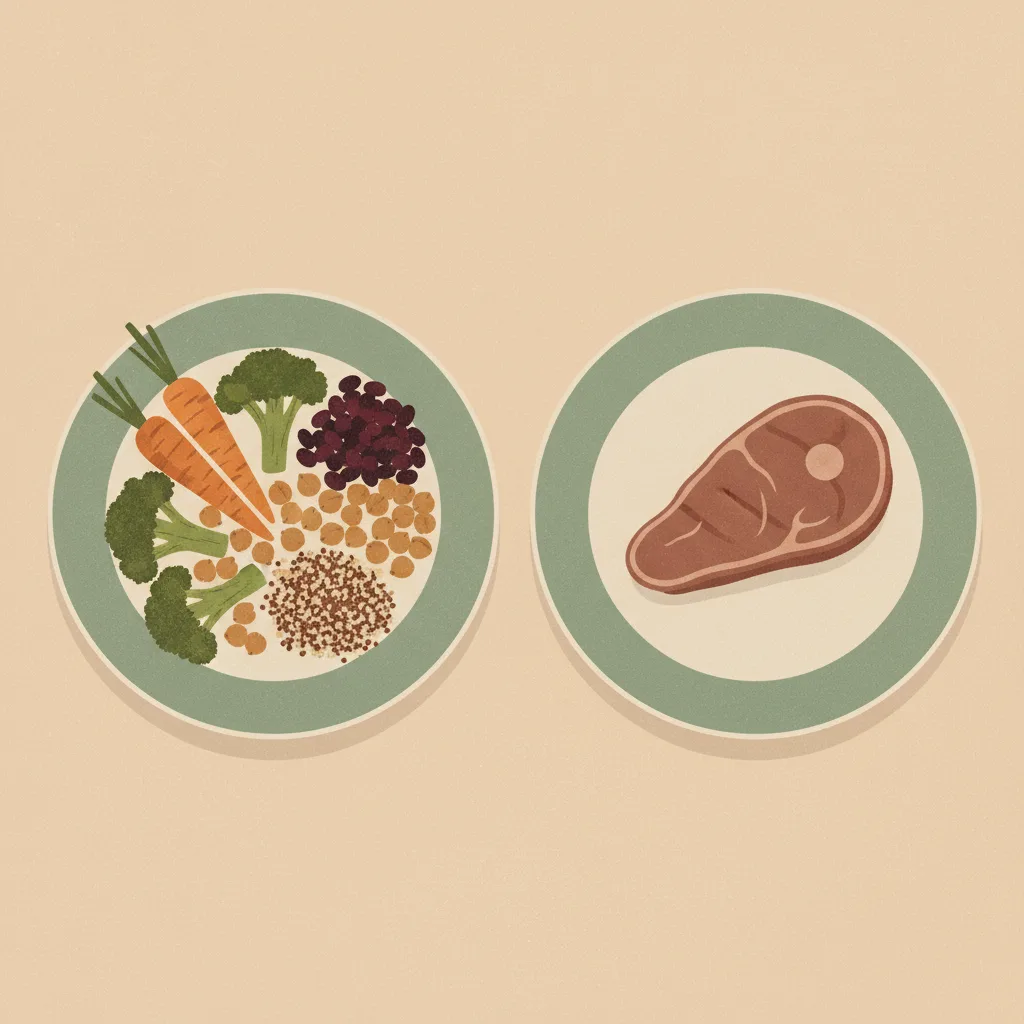
Tussen de maaltijden door snacken (modern graspatroon) versus alleen eten op 2–3 gedefinieerde maaltijden zonder snacks
Als je handelt
Tussen de maaltijden door snacken
15%
Als je niets doet
Alleen eten op 2–3 gedefinieerde maaltijden (geen snacks)
27%
Percentage dat later spijt heeft van elke keuze. De balken en het volledige overzicht staan hieronder.
Levensstijl
Laatst beoordeeld 2026-05-30
Kwaliteit van bewijs 3.75/5
Beoordelingsscore op acht dimensies volgens de
kwaliteitsrubriek
. Elke dimensie krijgt een score van 1 tot 5.
D1 Bronverificatie
4/5
D2 Autoriteit en onafhankelijkheid van bronnen
5/5
D3 Nauwkeurigheid van spijtcijfer
2/5
D4 Vergelijkbaarheid van bronnen
4/5
D5 Gilovich-patroon
3/5
D6 Prozakwaliteit
4/5
D7 Volledigheid van voorbehouden
3/5
D8 Steekproefkwaliteit
5/5
Gemiddelde3.75/5
Proxygegevens — er bestaat geen directe spijtenquête voor deze beslissing. De percentages zijn afgeleid van tevredenheidsscores en toegangsdrempelgegevens in plaats van vragen die direct naar spijt vroegen. Zie opmerkingen hieronder.
Spijt van handelen
Tussen de maaltijden door snacken
15%
~15% van de Amerikaanse volwassenen stelt een goed voornemen voor het nieuwe jaar dat gericht is op het minderen van snacks/suikerhoudend voedsel (het snackspecifieke aandeel van Purdue's cijfer van 25% voor alle voedselvoornemens — prospectief uitgesproken intentie, geen retrospectieve spijt)
Amerikaanse volwassenen, nationaal representatief
doorsnede, januari 2024 afgenomen
Spijt van nalaten
Alleen eten op 2–3 gedefinieerde maaltijden (geen snacks)
27%
27% van de Amerikaanse volwassenen werkt actief aan gewichtsverlies (proxy voor gewichtsmanagement-intentie — geen directe spijt over het patroon van enkel maaltijden)
Amerikaanse volwassenen, nationaal representatief
doorsnede, afgenomen op 6–20 november 2024
% betreurt deze keuze
Tussen de maaltijden door snackenAlleen eten op 2–3 gedefinieerde maaltijden (geen snacks)
15%27%
inaction dominates — Niets doen domineert — de meesten hebben spijt dat ze niet handelden.
Gerelateerde keuzes
Semantisch vergelijkbare keuzes — zelfde terrein, andere afwegingen.
Twenty-seven percent of US adults are actively working to lose
weight, per Gallup’s November 2024 national poll of 1,001 adults
— the closest available proxy for dissatisfaction with eating patterns
that might motivate adopting a meals-only structure. That figure is
the inaction-side proxy shown above. It falls short of a direct regret
measure: the meals-only pattern is the minority position in the US,
so the question “do you regret not snacking?” is structurally rare,
and most adults who restrict to defined meals do so deliberately as
a weight-management or blood-sugar strategy rather than as a
regret-driven reversal of a prior snacking habit.
On the other side, 25% of US consumers set a food or nutrition-
related New Year’s resolution in 2024, per Purdue’s Consumer Food
Insights survey of 1,200 US adults — up six percentage points from
2023, with “the majority” planning to limit salty snacks, sugary
foods, regular soft drinks and alcohol. That 25% spans many dietary
goals, not snacking, so the action-side proxy is the snacking-specific
slice: roughly 13-18% of all US adults if “the majority” means about
half to two-thirds of those with resolutions, which we set at ~15%.
Even that ~15% is prospective intent to cut snacks, not retrospective
regret about a snacking habit. The structural
backdrop: USDA NHANES 2017-March 2020 data show 95% of US adults
snack on a given day, 78% snack multiple times, and among consumers
snacks contribute 24% of daily energy and 43% of added sugars. The
two figures come from different instruments (Purdue resolution
intent vs Gallup active weight-management) and measure different
constructs (prospective resolution vs current effort), so any
cross-side comparison is approximate.
The meal-frequency question is genuinely contested in the nutrition
literature. Bellisle’s 2014 Physiology & Behavior review concludes
that snacking neither clearly causes obesity nor clearly prevents
it, that eating frequency does not independently predict body weight
when total energy intake is controlled, and that the same eating
pattern can have different effects depending on food quality and
context. That weakens the case for either side carrying strong
regret: most US adults snack, most US adults who snack are not
measurably worse off for it when energy intake is matched, and the
few who reverse to a meals-only pattern do not have unambiguous
evidence that their previous behavior caused them measurable harm.
The ~12-point gap between the ~15% snacking-resolution share and the
27% active weight-management share is a difference between two weak,
non-comparable proxy instruments, not a measured difference in
regret. Readers should treat both figures as proxies for different
constructs and not read the delta as a precise regret comparison.
Bronnen: handelen
Bronnenverantwoording
Elk getal hieronder is wat elke bron rapporteerde, met het letterlijke citaat waarop we ons baseerden en hoe we tot ons cijfer kwamen. Klik op een link om rechtstreeks te verifiëren.
1/3 bronnen onafhankelijk woordelijk geverifieerd tegenover de geciteerde bron
[1]News-Medical / coverage of Purdue Consumer Food Insights Jan 2024 — Increasing New Year's resolutions for healthier eating, Purdue report finds
Gerenommeerde referentie
25% of US consumers had a food/nutrition-related New Year's resolution in 2024 (up 6 pp from 2023); the majority plan to increase fruits, vegetables and water while limiting salty snacks, sugary foods, regular soft drinks and alcohol; 46% anticipate cravings as an obstacle
Fragment
“"25% of consumers responded 'yes' when asked if they had any food or nutrition-related New Year's resolutions, up 6 percentage points from the response to the same question last year... the survey-based report out of Purdue University's Center for Food Demand Analysis and Sustainability...included 1,200 consumers across the U.S."
”
Brongegevens van
2024-02-15
Geraadpleegd
2026-05-30
Berekening
Purdue Center for Food Demand Analysis and Sustainability, Consumer Food Insights, Volume 3 Issue 1, January 2024, N=1,200 US consumers. The 25% headline is the share of US consumers with ANY food/nutrition-related New Year's resolution, covering many dietary goals (more fruit/veg/water, less salty snacks, sugary foods, soft drinks, alcohol) — it is NOT a snacking-specific figure and NOT a regret measure. Because the report says \"the majority\" of those resolutions target the salty-snacks/sugary-foods/soft-drinks/alcohol basket (not snacking alone), the snacking-targeted share is roughly 0.25 x ~50-70% = 13-18% of all US adults. We therefore set the action-side proxy to the midpoint, ~15% (regret_rate 0.15), and label it explicitly as prospective resolution intent to cut snacks/sugary foods, not retrospective regret about snacking. The earlier 25% figure fused the all-resolutions headline with a snacking claim and overstated the snacking-targeted signal; this has been corrected.
Onafhankelijkheid
Independent academic survey from Purdue's Center for Food Demand Analysis and Sustainability with publicly disclosed methodology; no commercial sponsorship of the consumer insights series.
[2]USDA Agricultural Research Service / Sebastian, Hoy, Goldman, Moshfegh — Snack Consumption by U.S. Adults: What We Eat in America, NHANES 2017 - March 2020
Overheidsrapport
95% of US adults aged 20+ consume one or more foods or beverages as a snack on the intake day; 78% consume two or more snacks; snacks provide on average 24% of daily energy and 43% of added sugars among consumers
Fragment
“"Among adults aged 20 years and older, 95% consume one or more foods and/or beverages at a snack on the intake day... Currently, consuming multiple snacks is the norm, with 78% consuming two or more on any given day. Among consumers, snacks provide on average 24% of daily intake of energy and 43% of added sugars."
”
Brongegevens van
2024-04-01
Geraadpleegd
2026-05-30
Berekening
USDA Dietary Data Brief No. 53, based on NHANES 2017-March 2020 nationally representative dietary recall data. Establishes the prevalence baseline: 95% of US adults snack at least once on a given day; 78% snack multiple times; snacks contribute 24% of daily energy and 43% of added sugars on average. Used here on the action side as the govt_report context: snacking is the normal modern US eating pattern, not a deviation. This is NOT the regret-rate figure; that is from Purdue Jan 2024 (see above). The NHANES data establishes that the question \"do you regret snacking?\" applies to nearly all US adults if at all, and that the dietary stakes (43% of added sugars from snacks among consumers) are concrete.
Onafhankelijkheid
US federal government data (NHANES via USDA ARS) with publicly disclosed methodology; no commercial sponsorship of the survey or analysis. Independent of the Purdue insights series.
[3]Journal of Nutrition / Piernas & Popkin — Snacking Increased among U.S. Adults between 1977 and 2006
Geverifieerd
Vakgenoten-beoordeeld
US adult snacking prevalence increased from 71% to 97% between 1977-78 and 2003-06; contribution of snacks to total energy intake increased from 18% to 24%
Fragment
“"snacking prevalence increased significantly from 71 to 97% in 2003-2006... the percentage of snacking on both d 1 and d 2 increased from 42 to 78%... the contribution of snacks to total energy intake increased from 18 to 24%."
”
Brongegevens van
2010-02-01
Geraadpleegd
2026-05-30
Verificatie
Fragment onafhankelijk opnieuw opgehaald en woord voor woord bevestigd tegenover de geciteerde bron tijdens onze onderbouwingsaudit.
Berekening
Piernas & Popkin (J Nutr 2010) established the long-run shift: US adult snacking went from a minority behavior (71% on any given day in 1977-78) to near-universal (97% by 2003-06), with the share of daily energy from snacks rising from 18% to 24%. Used on the action side as the peer-reviewed historical baseline for the prevalence claim above. This is NOT the action-side regret-rate figure; that is the snacking-specific share (~15%) derived from Purdue's January 2024 resolution survey (see above). Snacking-related regret has not been directly surveyed in the US, so the action side relies on a prospective resolution-intent proxy, not a retrospective regret measure.
Onafhankelijkheid
Independent academic analysis of CDC NHANES data; methodology publicly disclosed. No commercial sponsorship of the analysis.
Bronnen: niet handelen
Bronnenverantwoording
Elk getal hieronder is wat elke bron rapporteerde, met het letterlijke citaat waarop we ons baseerden en hoe we tot ons cijfer kwamen. Klik op een link om rechtstreeks te verifiëren.
2/2 bronnen onafhankelijk woordelijk geverifieerd tegenover de geciteerde bron
[1]Gallup News — 43% of Americans Say They Are Overweight; 55% Want to Slim Down
Geverifieerd
↗ 1 other entry
Gerenommeerde referentie
27% of US adults are actively working to lose weight; 55% want to lose weight; 43% view themselves as overweight
Fragment
“"43%, view themselves as overweight... 55%, say they want to lose weight... only 27% report they are actively working toward that goal."
”
Brongegevens van
2024-12-10
Geraadpleegd
2026-05-30
Verificatie
Fragment onafhankelijk opnieuw opgehaald en woord voor woord bevestigd tegenover de geciteerde bron tijdens onze onderbouwingsaudit.
Berekening
Gallup national poll, N=1,001 US adults, fielded November 6-20, 2024, margin of error ±4 percentage points. Used here as the inaction-side proxy: 27% of US adults are actively pursuing weight management, a state that implies current dissatisfaction with some aspect of current eating behavior including the absence of structural snacking discipline. This is NOT a direct regret measure about the meals-only pattern; in fact, the meals-only pattern is the minority position (95% of US adults snack daily per NHANES), so the question \"do you regret not snacking?\" is structurally rare. The 27% captures the directional signal: a substantial minority of US adults are actively dissatisfied enough with their current diet to do something about it, and \"cut the snacks\" is one of the most common dietary-change targets in popular guidance.
Onafhankelijkheid
Independent Gallup national poll using random-digit-dial methodology; no shared sample with USDA NHANES or Piernas & Popkin. Different methodology and different construct.
[2]Physiology & Behavior / France Bellisle — Meals and snacking, diet quality and energy balance
Geverifieerd
Vakgenoten-beoordeeld
Snacking may contribute to excess energy intake and weight gain via context, frequency and food quality; in some reports snacking facilitates energy-intake adjustment to needs, in others (especially obese populations) it contributes energy but little nutrition
Fragment
“"Snacking may contribute to excess energy intake and weight gain through different ways, for example: context/environment of eating, frequency of consumption and quality of food choices. In many reports, snacking appears to facilitate the adjustment of energy intake to needs, and to contribute carbohydrates, rather than fats, to the diet. By contrast, snacking often appears to contribute much energy but little nutrition in the diet of other consumers, particularly obese children and adults."
”
Brongegevens van
2014-07-01
Geraadpleegd
2026-05-30
Verificatie
Fragment onafhankelijk opnieuw opgehaald en woord voor woord bevestigd tegenover de geciteerde bron tijdens onze onderbouwingsaudit.
Berekening
Bellisle (Physiology & Behavior 2014) is the canonical peer- reviewed review framing the meal-frequency literature. The critical finding: eating frequency does not independently predict body weight when total energy intake is controlled. Used here on the inaction side as the literature basis for the observation that the case for a meals-only pattern is genuinely contested — snacking neither clearly causes obesity nor clearly prevents it, and the same eating pattern can have different effects depending on food quality and context. This is NOT the regret rate; that is from Gallup 2024. Bellisle's review provides the scientific context that weakens the case for the inaction side carrying strong regret: most US adults snack, most US adults who snack are not measurably worse off for it when energy intake is matched, and the few who reverse to a meals-only pattern do not have unambiguous evidence that their previous behavior was harmful.
Onafhankelijkheid
Independent peer-reviewed academic review with publicly disclosed methodology; Bellisle has published widely on eating frequency, including some industry-funded studies on snacking listed in her overall body of work but the 2014 P&B review is not directly industry-sponsored.
Kanttekeningen
Geen van beide zijden meet spijt rechtstreeks, en geen gepubliceerde Amerikaanse enquête vraagt frontaal "heb je spijt van snacken tussen de maaltijden door?" of "heb je spijt dat je niet snackt?" De vraag over maaltijdfrequentie is werkelijk omstreden in de voedingsliteratuur (Bellisle 2014, Physiol Behav): eetfrequentie voorspelt niet onafhankelijk het lichaamsgewicht wanneer de totale energie-inname wordt gecontroleerd. De Purdue Consumer Food Insights-enquête van januari 2024 stelde vast dat 25% van de Amerikaanse consumenten ENIG voedings-/nutritievoornemen voor het nieuwe jaar heeft; die 25% beslaat vele voedingsdoelen, niet snacken. Omdat "de meerderheid" van die voornemens gericht is op de mand met zoute snacks/suikerhoudend voedsel/frisdrank/alcohol, is het snackspecifieke aandeel ongeveer 13-18% van alle Amerikaanse volwassenen, dus zetten we de proxy aan de actiezijde op het middelpunt, ~15%. (Een eerdere versie gebruikte de volledige 25%, wat de kop over alle voornemens versmolt met een snackclaim en het actiesignaal overschatte.) Zelfs bij 15% is dit prospectieve intentie tot een voornemen, geen retrospectieve spijt over snacken. De 27% aan de inactiezijde is het Gallup-aandeel van november 2024 van Amerikaanse volwassenen dat actief aan gewichtsverlies werkt — een verwant maar indirect signaal, en het patroon van enkel maaltijden is zelf de minderheidspositie in de VS (95% van de Amerikaanse volwassenen snackt dagelijks volgens USDA NHANES 2017-maart 2020), dus de vraag "heb je spijt dat je niet snackt?" is structureel zeldzaam. We gebruiken het cijfer van 27% actieve gewichtsinspanning als de dichtstbijzijnde beschikbare proxy die aan spijt grenst. De twee cijfers komen uit verschillende instrumenten en populaties (Purdue-enquête over voornemen-intentie versus Gallup-peiling over actief gewichtsmanagement) en meten verschillende constructen (prospectief voornemen versus huidige inspanning), dus elke vergelijking tussen de zijden is bij benadering en mag niet als een precieze spijtkloof worden gelezen. De regret_delta van ~12 punten weerspiegelt twee niet-vergelijkbare proxy-instrumenten, geen gemeten verschil in spijt. Onder de spijtvraag ligt de omstreden causaliteit: NHANES-data laten zien dat snacks 24% van de dagelijkse energie en 43% van de toegevoegde suikers bij consumenten leveren, wat het snackpatroon vaststelt als een belangrijke bijdrager aan een voedingsarme calorie-inname, maar Bellisle's overzicht betoogt dat de dimensie maaltijdfrequentie grotendeels ondergeschikt is aan de totale energie-inname en de voedselkwaliteit.