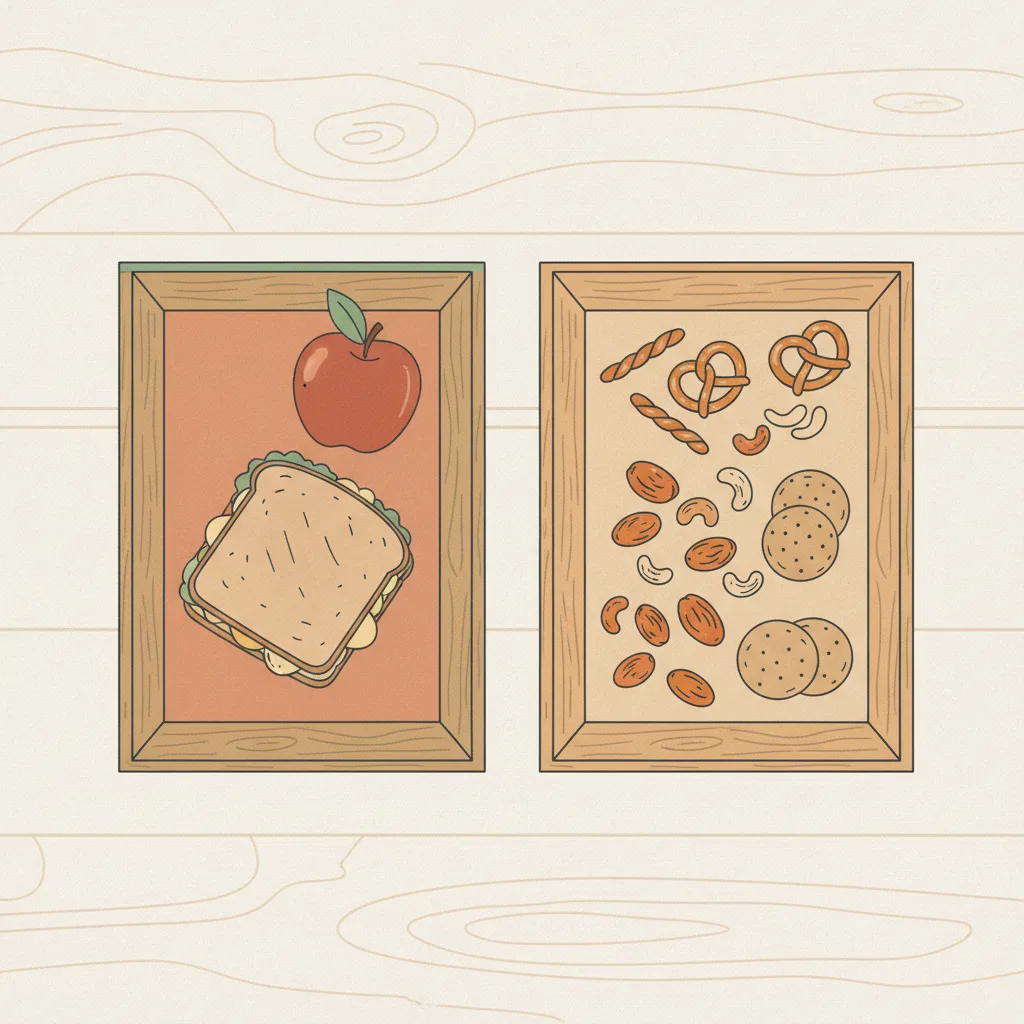
Podjadanie między posiłkami (nowoczesny model pasienia) vs jedzenie tylko 2-3 określonych posiłków bez przekąsek
Jeśli działasz
Podjadanie między posiłkami
15%
Jeśli nie działasz
Jedzenie tylko 2-3 określonych posiłków (bez przekąsek)
27%
Odsetek osób, które później żałują każdego wyboru. Słupki i pełna kartoteka danych poniżej.
Styl życia
Ostatnio sprawdzono 2026-05-30
Jakość dowodów 3.75/5
Ocena recenzji w ośmiu wymiarach względem
rubryki jakości
. Każdy wymiar oceniony w skali 1–5.
D1 Weryfikacja źródeł
4/5
D2 Autorytet i niezależność źródeł
5/5
D3 Dokładność wskaźnika żalu
2/5
D4 Porównywalność źródeł
4/5
D5 Wzorzec Gilovicha
3/5
D6 Jakość tekstu
4/5
D7 Kompletność zastrzeżeń
3/5
D8 Jakość próby
5/5
Średnia3.75/5
Dane zastępcze — dla tej decyzji nie istnieje bezpośrednie badanie żałowania. Wskaźniki są oparte na ocenach zadowolenia i danych o barierach dostępu, a nie na pytaniach bezpośrednio dotyczących żałowania. Zobacz zastrzeżenia poniżej.
Żal za działanie
Podjadanie między posiłkami
15%
~15% dorosłych Amerykanów podejmuje noworoczne postanowienie dotyczące ograniczenia przekąsek/słodyczy (specyficzny dla przekąsek udział w 25% figurze Purdue dotyczącej jakiegokolwiek postanowienia żywieniowego — prospektywnie deklarowany zamiar, nie retrospektywny żal)
Dorośli w USA, ogólnokrajowo reprezentatywnie
przekrojowo, przeprowadzono w styczniu 2024
Żal za zaniechanie
Jedzenie tylko 2-3 określonych posiłków (bez przekąsek)
27%
27% dorosłych Amerykanów aktywnie stara się schudnąć (zastępcza miara zamiaru kontroli wagi — nie bezpośredni żal z powodu wzorca posiłków bez przekąsek)
Dorośli w USA, ogólnokrajowo reprezentatywnie
przekrojowo, przeprowadzono 6-20 listopada 2024
% żałuje tej decyzji
Podjadanie między posiłkamiJedzenie tylko 2-3 określonych posiłków (bez przekąsek)
15%27%
inaction dominates — Bezczynność dominuje — większość żałuje, że nie podjęła działania.
Powiązane decyzje
Semantycznie podobne decyzje — ten sam obszar, inne kompromisy.
Twenty-seven percent of US adults are actively working to lose
weight, per Gallup’s November 2024 national poll of 1,001 adults
— the closest available proxy for dissatisfaction with eating patterns
that might motivate adopting a meals-only structure. That figure is
the inaction-side proxy shown above. It falls short of a direct regret
measure: the meals-only pattern is the minority position in the US,
so the question “do you regret not snacking?” is structurally rare,
and most adults who restrict to defined meals do so deliberately as
a weight-management or blood-sugar strategy rather than as a
regret-driven reversal of a prior snacking habit.
On the other side, 25% of US consumers set a food or nutrition-
related New Year’s resolution in 2024, per Purdue’s Consumer Food
Insights survey of 1,200 US adults — up six percentage points from
2023, with “the majority” planning to limit salty snacks, sugary
foods, regular soft drinks and alcohol. That 25% spans many dietary
goals, not snacking, so the action-side proxy is the snacking-specific
slice: roughly 13-18% of all US adults if “the majority” means about
half to two-thirds of those with resolutions, which we set at ~15%.
Even that ~15% is prospective intent to cut snacks, not retrospective
regret about a snacking habit. The structural
backdrop: USDA NHANES 2017-March 2020 data show 95% of US adults
snack on a given day, 78% snack multiple times, and among consumers
snacks contribute 24% of daily energy and 43% of added sugars. The
two figures come from different instruments (Purdue resolution
intent vs Gallup active weight-management) and measure different
constructs (prospective resolution vs current effort), so any
cross-side comparison is approximate.
The meal-frequency question is genuinely contested in the nutrition
literature. Bellisle’s 2014 Physiology & Behavior review concludes
that snacking neither clearly causes obesity nor clearly prevents
it, that eating frequency does not independently predict body weight
when total energy intake is controlled, and that the same eating
pattern can have different effects depending on food quality and
context. That weakens the case for either side carrying strong
regret: most US adults snack, most US adults who snack are not
measurably worse off for it when energy intake is matched, and the
few who reverse to a meals-only pattern do not have unambiguous
evidence that their previous behavior caused them measurable harm.
The ~12-point gap between the ~15% snacking-resolution share and the
27% active weight-management share is a difference between two weak,
non-comparable proxy instruments, not a measured difference in
regret. Readers should treat both figures as proxies for different
constructs and not read the delta as a precise regret comparison.
Źródła: działanie
Rejestr twierdzeń
Każda liczba poniżej jest tym, co podało dane źródło — z dosłownym cytatem, na którym się oparliśmy, i sposobem, w jaki doszliśmy do naszej wartości. Kliknij dowolny link, żeby zweryfikować bezpośrednio.
1/3 źródeł niezależnie zweryfikowanych słowo w słowo z podanym źródłem
[1]News-Medical / coverage of Purdue Consumer Food Insights Jan 2024 — Increasing New Year's resolutions for healthier eating, Purdue report finds
Źródło referencyjne
25% of US consumers had a food/nutrition-related New Year's resolution in 2024 (up 6 pp from 2023); the majority plan to increase fruits, vegetables and water while limiting salty snacks, sugary foods, regular soft drinks and alcohol; 46% anticipate cravings as an obstacle
Cytat
“"25% of consumers responded 'yes' when asked if they had any food or nutrition-related New Year's resolutions, up 6 percentage points from the response to the same question last year... the survey-based report out of Purdue University's Center for Food Demand Analysis and Sustainability...included 1,200 consumers across the U.S."
”
Dane źródłowe z
2024-02-15
Dostęp
2026-05-30
Obliczenie
Purdue Center for Food Demand Analysis and Sustainability, Consumer Food Insights, Volume 3 Issue 1, January 2024, N=1,200 US consumers. The 25% headline is the share of US consumers with ANY food/nutrition-related New Year's resolution, covering many dietary goals (more fruit/veg/water, less salty snacks, sugary foods, soft drinks, alcohol) — it is NOT a snacking-specific figure and NOT a regret measure. Because the report says \"the majority\" of those resolutions target the salty-snacks/sugary-foods/soft-drinks/alcohol basket (not snacking alone), the snacking-targeted share is roughly 0.25 x ~50-70% = 13-18% of all US adults. We therefore set the action-side proxy to the midpoint, ~15% (regret_rate 0.15), and label it explicitly as prospective resolution intent to cut snacks/sugary foods, not retrospective regret about snacking. The earlier 25% figure fused the all-resolutions headline with a snacking claim and overstated the snacking-targeted signal; this has been corrected.
Niezależność
Independent academic survey from Purdue's Center for Food Demand Analysis and Sustainability with publicly disclosed methodology; no commercial sponsorship of the consumer insights series.
[2]USDA Agricultural Research Service / Sebastian, Hoy, Goldman, Moshfegh — Snack Consumption by U.S. Adults: What We Eat in America, NHANES 2017 - March 2020
Raport rządowy
95% of US adults aged 20+ consume one or more foods or beverages as a snack on the intake day; 78% consume two or more snacks; snacks provide on average 24% of daily energy and 43% of added sugars among consumers
Cytat
“"Among adults aged 20 years and older, 95% consume one or more foods and/or beverages at a snack on the intake day... Currently, consuming multiple snacks is the norm, with 78% consuming two or more on any given day. Among consumers, snacks provide on average 24% of daily intake of energy and 43% of added sugars."
”
Dane źródłowe z
2024-04-01
Dostęp
2026-05-30
Obliczenie
USDA Dietary Data Brief No. 53, based on NHANES 2017-March 2020 nationally representative dietary recall data. Establishes the prevalence baseline: 95% of US adults snack at least once on a given day; 78% snack multiple times; snacks contribute 24% of daily energy and 43% of added sugars on average. Used here on the action side as the govt_report context: snacking is the normal modern US eating pattern, not a deviation. This is NOT the regret-rate figure; that is from Purdue Jan 2024 (see above). The NHANES data establishes that the question \"do you regret snacking?\" applies to nearly all US adults if at all, and that the dietary stakes (43% of added sugars from snacks among consumers) are concrete.
Niezależność
US federal government data (NHANES via USDA ARS) with publicly disclosed methodology; no commercial sponsorship of the survey or analysis. Independent of the Purdue insights series.
[3]Journal of Nutrition / Piernas & Popkin — Snacking Increased among U.S. Adults between 1977 and 2006
Zweryfikowane
Recenzowane naukowo
US adult snacking prevalence increased from 71% to 97% between 1977-78 and 2003-06; contribution of snacks to total energy intake increased from 18% to 24%
Cytat
“"snacking prevalence increased significantly from 71 to 97% in 2003-2006... the percentage of snacking on both d 1 and d 2 increased from 42 to 78%... the contribution of snacks to total energy intake increased from 18 to 24%."
”
Dane źródłowe z
2010-02-01
Dostęp
2026-05-30
Weryfikacja
Cytat niezależnie pobrany ponownie i potwierdzony słowo w słowo z podanym źródłem podczas naszego audytu ugruntowania.
Obliczenie
Piernas & Popkin (J Nutr 2010) established the long-run shift: US adult snacking went from a minority behavior (71% on any given day in 1977-78) to near-universal (97% by 2003-06), with the share of daily energy from snacks rising from 18% to 24%. Used on the action side as the peer-reviewed historical baseline for the prevalence claim above. This is NOT the action-side regret-rate figure; that is the snacking-specific share (~15%) derived from Purdue's January 2024 resolution survey (see above). Snacking-related regret has not been directly surveyed in the US, so the action side relies on a prospective resolution-intent proxy, not a retrospective regret measure.
Niezależność
Independent academic analysis of CDC NHANES data; methodology publicly disclosed. No commercial sponsorship of the analysis.
Źródła: bezczynność
Rejestr twierdzeń
Każda liczba poniżej jest tym, co podało dane źródło — z dosłownym cytatem, na którym się oparliśmy, i sposobem, w jaki doszliśmy do naszej wartości. Kliknij dowolny link, żeby zweryfikować bezpośrednio.
2/2 źródeł niezależnie zweryfikowanych słowo w słowo z podanym źródłem
[1]Gallup News — 43% of Americans Say They Are Overweight; 55% Want to Slim Down
Zweryfikowane
↗ 1 other entry
Źródło referencyjne
27% of US adults are actively working to lose weight; 55% want to lose weight; 43% view themselves as overweight
Cytat
“"43%, view themselves as overweight... 55%, say they want to lose weight... only 27% report they are actively working toward that goal."
”
Dane źródłowe z
2024-12-10
Dostęp
2026-05-30
Weryfikacja
Cytat niezależnie pobrany ponownie i potwierdzony słowo w słowo z podanym źródłem podczas naszego audytu ugruntowania.
Obliczenie
Gallup national poll, N=1,001 US adults, fielded November 6-20, 2024, margin of error ±4 percentage points. Used here as the inaction-side proxy: 27% of US adults are actively pursuing weight management, a state that implies current dissatisfaction with some aspect of current eating behavior including the absence of structural snacking discipline. This is NOT a direct regret measure about the meals-only pattern; in fact, the meals-only pattern is the minority position (95% of US adults snack daily per NHANES), so the question \"do you regret not snacking?\" is structurally rare. The 27% captures the directional signal: a substantial minority of US adults are actively dissatisfied enough with their current diet to do something about it, and \"cut the snacks\" is one of the most common dietary-change targets in popular guidance.
Niezależność
Independent Gallup national poll using random-digit-dial methodology; no shared sample with USDA NHANES or Piernas & Popkin. Different methodology and different construct.
[2]Physiology & Behavior / France Bellisle — Meals and snacking, diet quality and energy balance
Zweryfikowane
Recenzowane naukowo
Snacking may contribute to excess energy intake and weight gain via context, frequency and food quality; in some reports snacking facilitates energy-intake adjustment to needs, in others (especially obese populations) it contributes energy but little nutrition
Cytat
“"Snacking may contribute to excess energy intake and weight gain through different ways, for example: context/environment of eating, frequency of consumption and quality of food choices. In many reports, snacking appears to facilitate the adjustment of energy intake to needs, and to contribute carbohydrates, rather than fats, to the diet. By contrast, snacking often appears to contribute much energy but little nutrition in the diet of other consumers, particularly obese children and adults."
”
Dane źródłowe z
2014-07-01
Dostęp
2026-05-30
Weryfikacja
Cytat niezależnie pobrany ponownie i potwierdzony słowo w słowo z podanym źródłem podczas naszego audytu ugruntowania.
Obliczenie
Bellisle (Physiology & Behavior 2014) is the canonical peer- reviewed review framing the meal-frequency literature. The critical finding: eating frequency does not independently predict body weight when total energy intake is controlled. Used here on the inaction side as the literature basis for the observation that the case for a meals-only pattern is genuinely contested — snacking neither clearly causes obesity nor clearly prevents it, and the same eating pattern can have different effects depending on food quality and context. This is NOT the regret rate; that is from Gallup 2024. Bellisle's review provides the scientific context that weakens the case for the inaction side carrying strong regret: most US adults snack, most US adults who snack are not measurably worse off for it when energy intake is matched, and the few who reverse to a meals-only pattern do not have unambiguous evidence that their previous behavior was harmful.
Niezależność
Independent peer-reviewed academic review with publicly disclosed methodology; Bellisle has published widely on eating frequency, including some industry-funded studies on snacking listed in her overall body of work but the 2014 P&B review is not directly industry-sponsored.
Zastrzeżenia
Żadna ze stron nie mierzy żalu bezpośrednio i żadne opublikowane amerykańskie badanie nie pyta wprost "czy żałujesz podjadania między posiłkami?" ani "czy żałujesz, że nie podjadasz?". Kwestia częstotliwości posiłków jest realnie sporna w literaturze żywieniowej (Bellisle 2014, Physiol Behav): częstotliwość jedzenia nie przewiduje niezależnie masy ciała, gdy kontroluje się całkowite spożycie energii. Badanie Purdue Consumer Food Insights ze stycznia 2024 r. wykazało, że 25% amerykańskich konsumentów ma JAKIEKOLWIEK noworoczne postanowienie dotyczące żywienia/odżywiania; te 25% obejmuje wiele celów dietetycznych, nie tylko przekąski. Ponieważ "większość" tych postanowień dotyczy koszyka słonych przekąsek/słodyczy/napojów gazowanych/alkoholu, udział specyficzny dla przekąsek wynosi z grubsza 13–18% wszystkich dorosłych Amerykanów, więc wskaźnik zastępczy po stronie działania ustawiliśmy na wartość środkową, ~15%. (Wcześniejsza wersja używała pełnych 25%, co łączyło nagłówek dotyczący wszystkich postanowień z twierdzeniem o przekąskach i zawyżało sygnał działania.) Nawet przy 15% jest to prospektywnie deklarowany zamiar postanowienia, a nie retrospektywny żal z powodu podjadania. 27% po stronie zaniechania to podany przez Gallupa w listopadzie 2024 r. odsetek dorosłych Amerykanów aktywnie starających się schudnąć — pokrewny, lecz pośredni sygnał, a sam wzorzec jedzenia bez przekąsek jest w USA pozycją mniejszościową (95% dorosłych Amerykanów podjada codziennie wg USDA NHANES 2017–marzec 2020), więc pytanie "czy żałujesz, że nie podjadasz?" jest strukturalnie rzadkie. Używamy liczby 27% aktywnego wysiłku odchudzania jako najbliższego dostępnego wskaźnika sąsiadującego z żalem. Obie liczby pochodzą z różnych narzędzi i populacji (badanie zamiaru postanowień Purdue vs sondaż aktywnej kontroli wagi Gallupa) i mierzą różne konstrukty (prospektywne postanowienie vs bieżący wysiłek), więc każde porównanie między stronami jest przybliżone i nie należy go odczytywać jako precyzyjnej różnicy żalu. ~12-punktowy regret_delta odzwierciedla dwa nieporównywalne narzędzia zastępcze, a nie zmierzoną różnicę żalu. U podstaw kwestii żalu leży sporna przyczynowość: dane NHANES pokazują, że przekąski dostarczają 24% dziennej energii i 43% cukrów dodanych wśród konsumentów, co ustala wzorzec podjadania jako istotny czynnik ubogiego w składniki odżywcze spożycia kalorii, lecz przegląd Bellisle'a argumentuje, że wymiar częstotliwości posiłków jest w dużej mierze podrzędny wobec całkowitego spożycia energii i jakości żywności.