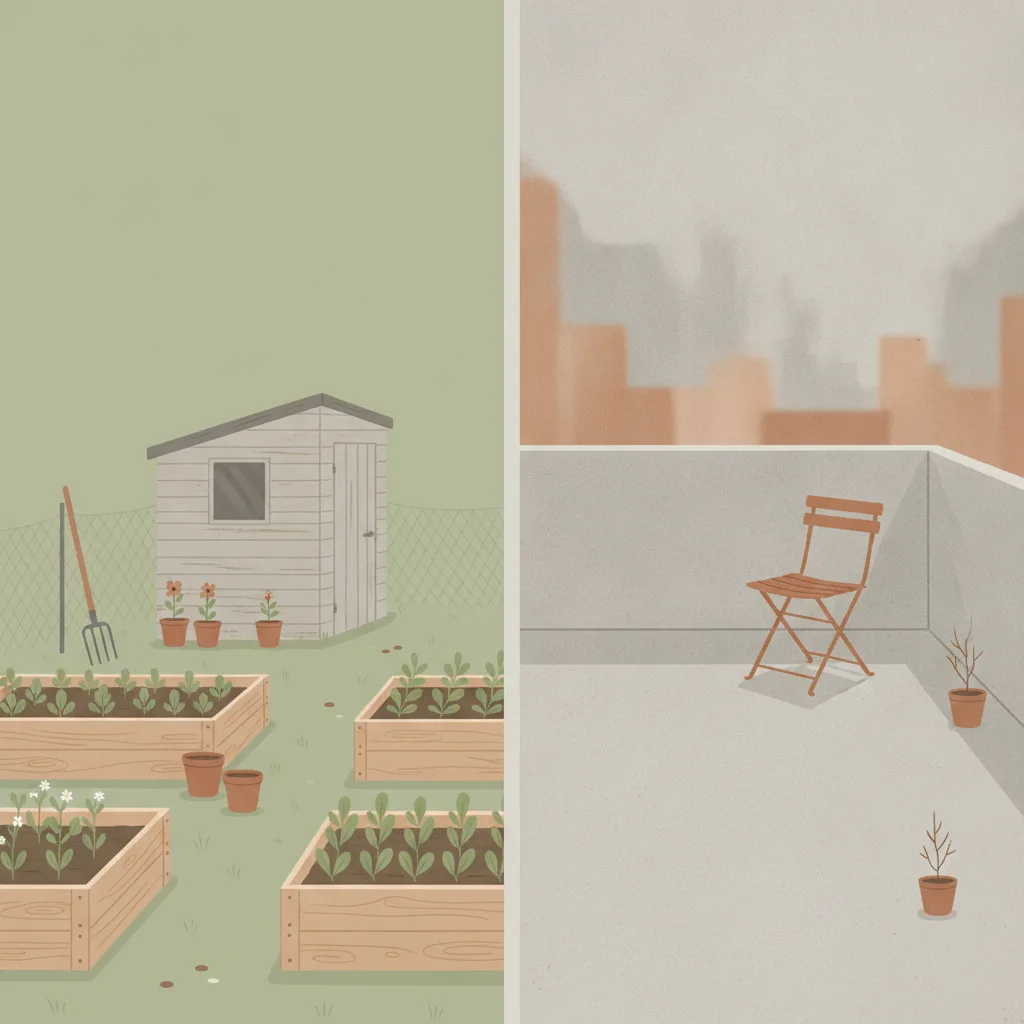
Obtenir un jardin ouvrier ou une parcelle de jardin partagé vs. rester sans
Si vous agissez
Prendre un jardin ouvrier ou une parcelle partagée
8,0%
Si vous n’agissez pas
Rester sans jardin ni parcelle
38%
Au moins un chiffre est une estimation indirecte, et non un taux de regret mesuré. La façon dont chaque chiffre a été obtenu est expliquée plus bas.
Mode de vie
Dernière révision 2026-05-04
Qualité des preuves 4.13/5
Score d’évaluation en huit dimensions selon la
grille de qualité
. Chaque dimension notée de 1 à 5.
D1 Vérification des sources
5/5
D2 Autorité et indépendance des sources
4/5
D3 Précision du taux de regret
2/5
D4 Comparabilité des sources
3/5
D5 Motif de Gilovich
5/5
D6 Qualité de la prose
5/5
D7 Complétude des réserves
5/5
D8 Qualité de l’échantillon
4/5
Moyenne4.13/5
Données indirectes : pour cette décision, au moins un chiffre provient d'une mesure indirecte, comme les conséquences, la satisfaction ou l'intention, ou d'une estimation de la rédaction, et non d'une enquête qui mesure directement le regret. Les notes de chaque côté, plus bas, expliquent comment chaque chiffre a été obtenu.
Si vous agissez
Prendre un jardin ouvrier ou une parcelle partagée
8,0%
91,9% des titulaires de jardins ouvriers évaluent le bénéfice de leur parcelle sur la santé mentale à 8/10 ou plus (indicateur indirect de satisfaction — aucune enquête directe de regret ou d'abandon de parcelle n'existe ; les ~8% affichés sont la part qui n'attribue pas la note maximale, ET NON un taux de regret mesuré)
Détenteurs de parcelles d'allotissement au Royaume-Uni
enquête rétrospective, 2025
Si vous n’agissez pas
Rester sans jardin ni parcelle
38%
~38% des non-jardiniers citent le manque d'accès comme raison pour laquelle ils ne jardinent pas
Adultes britanniques qui n'ont pas jardiné dans les 12 derniers mois
enquête transversale, 2025
Chiffre pour chaque choix (la mesure est nommée sur la page)
Prendre un jardin ouvrier ou une parcelle partagéeRester sans jardin ni parcelle
8,0%38%
Décisions associées
Décisions sémantiquement similaires — même terrain, compromis différents.
Chiffre pour chaque choix (la mesure est nommée sur la page)
Poursuite active de la longévité (jeûne, suppléments, biohacking)Accepter le vieillissement standard (pas de biohacking, soins médicaux conventionnels)
Approximately 91.9% of UK allotment plot holders rate the mental health benefit
of their plot at 8 or higher out of 10, with 63% giving a perfect 10, according to
the National Allotment Society’s 2025 survey of approximately 2,000 holders. A 2010
peer-reviewed study in Environmental Health (van den Berg et al.) reached the same
figure independently: 91% of Dutch allotment gardeners reported increased happiness
after visiting their plot, and their life satisfaction scores were significantly
higher than those of matched non-gardening neighbors drawn from the same residential
areas (2.26 vs 2.12, p<0.05). Neither survey asked holders whether they regret
their plot; both measured benefit ratings, and in both the residual 8–9% is simply
the share who did not give the top positive response rather than a count of people
who wished they had not taken a plot. No published study reports a direct allotment
regret or relinquishment-due-to-regret rate, so the figure shown here is a
satisfaction-tail proxy, not a measured regret rate. The pattern
holds across age groups but is sharpest in older adults: among those over 62, the
Dutch gardeners scored 0.32 on a composite wellbeing index versus −0.26 for same-age
neighbors, and loneliness scores diverged by a factor of nearly three.
The inaction side is structured by access rather than preference. The RHS State of
Gardening 2025 found that 38% of UK adults who had not gardened in the past year
cited lack of access to growing space as the reason — the largest single barrier,
and one that implies desire without opportunity rather than chosen non-participation.
In the same RHS survey, 14.7 million adults said they would be interested in
volunteering for organised community gardening sessions, while 2.5 million had
taken part in community gardening initiatives over the past three years. Over
174,000 people are on UK waiting lists for allotment plots at any given time, with
average waits of four years nationally and up to twelve years in some London boroughs.
This is unusual among decisions studied here: the inaction group is partly
involuntary, shaped by land supply and local authority policy rather than freely
chosen preference. Whether one frames that constraint as regret or frustration, it
is directionally the same: a large population wants the outcome and does not have it.
The Gilovich inaction-dominance pattern is among the more robust in this dataset for
this topic, though both sides rest on proxies rather than direct regret questions.
The roughly 30-percentage-point gap between the action-side satisfaction-tail proxy
(~8% non-top rating) and the inaction-side access-barrier proxy (~38% cite lack of
access) is consistent across UK survey data and the Dutch controlled study, and
it is consistent with findings in adjacent decisions like gym membership and therapy
— categories where the barrier to starting tends to feel large and the regret after
starting tends to be low. The specific mechanism is well-documented: allotment
holders visit regularly (unlike vacation cabin owners), the costs are low relative to
perceived benefit, and the social dimension of a shared site appears to add value
that solo garden ownership does not. For those fortunate enough to reach the front
of a waiting list, the decision to take the plot is almost universally reported as
the right one.
Sources : action
Registre des sources
Chaque chiffre ci-dessous correspond à ce que la source a rapporté, avec la citation textuelle sur laquelle nous nous sommes appuyés et la méthode de calcul. Cliquez sur un lien pour vérifier directement.
2/2 sources vérifiées de manière indépendante, mot pour mot, par rapport à la source citée
[1]National Allotment Society (via Pressat press office) — Growing the Evidence: Survey Shows the Power of Allotments
Vérifié
Source de référence
91.9% of UK allotment holders rate mental health benefits at 8/10 or higher; 63% give a perfect 10/10
Extrait
“"Nearly 63% of respondents rated the impact of their allotment on mental wellbeing a perfect 10, with 91.9% scoring it 8 or higher. Physical health benefits were similarly high, with 88.1% rating them 8 or above. 89.2% increased their fresh produce intake after getting a plot. 80.3% credited their plot with forming new social relationships."
”
Données source de
2025-08-11
Consulté le
2026-05-04
Vérification
Extrait récupéré et confirmé de manière indépendante, mot pour mot, par rapport à la source citée lors de notre audit de vérification.
Calcul
NAS 2025 survey of approximately 2,000 UK allotment plot holders. The survey measured benefit ratings, not regret: 91.9% rated the plot's mental-health benefit 8/10 or higher. The 8% stored as regret_rate is the arithmetic complement of that 91.9% (those who did NOT give a top-band rating), i.e. the satisfaction-score tail — NOT a dissatisfaction or regret rate. No question asked "do you regret getting an allotment", and no published survey measures allotment regret or relinquishment-due-to-regret (the 2024 Birmingham study of 876 tenants, Bloomfield, reports tenure — 9% held a plot <1 year, 36% 1–5 years — but no regret/quit rate; the 2025 APSE Local Authority State of the Market survey reports waiting-list demand, not plot abandonment). The non-top rating share is used only as the closest available proxy, with that limitation stated explicitly in the display and caveats. It is in the same range as the Netherlands peer-reviewed study (van den Berg et al. 2010), where 91% of allotment gardeners reported increased happiness after plot visits — again a positive-rating figure, not a measure of regret. The residual 8–9% in both samples is the share who did not give the top positive response, not a count of people who wished they had not taken a plot.
Indépendance
NAS is an independent UK charity that represents allotment holders. This survey is independent of the RHS, van den Berg academic study, and any commercial or government source.
[2]Environmental Health (BioMed Central / Springer) — Allotment gardening and health: a comparative survey among allotment gardeners and their neighbors without an allotment
Vérifié
Revue par les pairs
91% of allotment gardeners reported increased happiness after plot visits; life satisfaction 2.26 vs 2.12 for non-gardening neighbors (p<0.05)
Extrait
“"Eighty-four percent reported feeling healthier after a visit to the allotment garden. [...] 91 percent reported feeling happier and 86 percent reported feeling less stressed."
”
Données source de
2010-10-27
Consulté le
2026-05-04
Vérification
Extrait récupéré et confirmé de manière indépendante, mot pour mot, par rapport à la source citée lors de notre audit de vérification.
Calcul
van den Berg et al. (2010) surveyed 121 allotment gardeners and 63 matched non-allotment neighbors recruited from the same residential areas near 12 allotment sites in 8 Dutch cities (July–September sampling). Both groups completed the same wellbeing questionnaire, providing a genuine comparison of people who garden vs. comparable people who do not. The 91% happiness increase rate among gardeners implies approximately 9% who did not report this outcome — consistent with the NAS 2025 UK figure. Used here as the independent peer-reviewed anchor corroborating the NAS satisfaction finding.
Indépendance
Independent of all other sources: peer-reviewed academic study published in a Springer/BioMed Central journal, conducted by Dutch university researchers (Wageningen UR), using a controlled matched-sample design rather than a self-selected holder survey. Different country (Netherlands), different year (2010), different methodology.
Sources : inaction
Registre des sources
Chaque chiffre ci-dessous correspond à ce que la source a rapporté, avec la citation textuelle sur laquelle nous nous sommes appuyés et la méthode de calcul. Cliquez sur un lien pour vérifier directement.
1/2 sources vérifiées de manière indépendante, mot pour mot, par rapport à la source citée
[1]Royal Horticultural Society — RHS State of Gardening Report 2025
Source de référence
38% of non-gardeners cite lack of access to indoor or outdoor growing space as the reason they do not garden; 8.5 million people have never gardened, many of whom lack access to suitable space
Extrait
“"Notably, 38% of non-gardeners had no space in which to garden. [...] 2.5m people took part in community gardening initiatives over the past three years [...] yet 8.5 million people have never gardened [...] 14.7 million adults said they would be interested in volunteering for organised community gardening sessions."
”
Données source de
2025-01-01
Consulté le
2026-05-04
Calcul
RHS State of Gardening is the annual national survey of UK gardening participation and barriers. The 38% access-barrier figure measures the share of recent non-gardeners who attribute their non-participation to lacking space rather than lacking interest — i.e., they want to garden but cannot. This is a proxy for inaction regret: access-deprived non-gardeners represent a population that wants the outcome (a plot) but does not have it. The 14.7 million figure counts adults interested in volunteering for organised community gardening sessions; it measures interest in volunteering, not a wish for a plot, and is only a rough population-level scale check. METHODOLOGICAL CAVEAT: "cites access as the barrier" is not the same as "regrets not having a plot" — the 38% is the best available proxy, not a direct regret measurement. The waiting list data (174,000+ on UK allotment lists, average wait 4 years) corroborates the scale of unmet demand.
Indépendance
The RHS is the UK's leading horticultural charity, independent of the NAS and of the van den Berg academic research. The RHS State of Gardening surveys general UK adults, not specifically allotment holders, making it methodologically complementary to the NAS holder-only survey.
[2]Environmental Health (BioMed Central / Springer) — Allotment gardening and health: a comparative survey among allotment gardeners and their neighbors without an allotment
Vérifié
Revue par les pairs
Non-allotment neighbors scored significantly lower on life satisfaction (2.12 vs 2.26, p<0.05) and loneliness (aged 62+: 0.80 vs 0.28) compared to allotment gardeners in the same residential areas
Extrait
“"84 percent of the allotment gardeners met the Dutch guideline [...] this norm was met by only 62 percent of the respondents in the control group."
”
Données source de
2010-10-27
Consulté le
2026-05-04
Vérification
Extrait récupéré et confirmé de manière indépendante, mot pour mot, par rapport à la source citée lors de notre audit de vérification.
Calcul
The non-gardening neighbor group in van den Berg et al. (2010) represents the inaction side: people living near allotments who do not garden. Their measurably lower life satisfaction (p<0.05) and higher loneliness scores provide peer-reviewed evidence that the non-gardening state is associated with worse wellbeing outcomes than the gardening state. This is a wellbeing gap, not a direct regret measurement, but it is the strongest controlled evidence available for the cost of the inaction choice. Used here as the independent corroborating anchor for the RHS access-barrier finding.
Indépendance
Same study as cited on the action side; used here as the inaction-side comparison group. The neighbor group (n=63) and gardener group (n=121) were both recruited from the same residential areas, providing the closest available controlled comparison.
Réserves
MESURES INDIRECTES — AUCUN DES DEUX CÔTÉS N'UTILISE UNE QUESTION DE REGRET DIRECTE. Aucune enquête ou étude publiée dans la littérature sur les jardins ouvriers ne demande directement aux titulaires s'ils regrettent d'avoir obtenu une parcelle, ni aux non-titulaires s'ils regrettent de ne pas en avoir. Le taux d'action de 8% est le complément du score de satisfaction de 91,9% (NAS 2025) — une inversion de satisfaction, non une mesure de regret. Le taux d'inaction de 38% est la part invoquant un obstacle d'accès — « cite l'accès comme raison pour laquelle je ne jardine pas » ≠ « regrette de ne pas avoir de parcelle ». Les deux sont les indicateurs indirects les plus proches disponibles ; il n'existe pas de meilleures données dans la littérature publiée. BIAIS DE SURVIE / D'ATTRITION : l'enquête NAS 2025 ne couvre que les titulaires actuels de parcelles. Les personnes ayant acquis une parcelle, l'ayant trouvée peu satisfaisante ou trop exigeante, et l'ayant abandonnée, ne sont pas représentées — leur exclusion signifie que la part réelle des anciens titulaires qui ne referaient pas ce choix est presque certainement plus élevée que le résidu de 8% de non-attribution de la note maximale affiché ici, qui est un indicateur indirect de la queue de satisfaction et non un taux de regret mesuré. INFLATION PAR DÉSIRABILITÉ SOCIALE : le jardinage en jardins ouvriers porte un fort cadrage culturel positif au Royaume-Uni (santé, communauté, durabilité). Les scores de satisfaction autodéclarés sont probablement gonflés par des effets de désirabilité sociale ; les titulaires peuvent sous-déclarer leur insatisfaction même dans une enquête anonyme. PETIT GROUPE DE COMPARAISON : la comparaison bilatérale évaluée par les pairs de van den Berg (2010) — la preuve contrôlée la plus solide de cette entrée — n'utilise que n=63 voisins non-jardiniers face à n=121 jardiniers de parcelles. À cette taille d'échantillon, l'écart de satisfaction de vie (2,26 contre 2,12, p<0,05) est statistiquement significatif mais l'intervalle de confiance est large ; la taille d'effet doit être traitée comme directionnelle plutôt que précise. PORTÉE DE POPULATION : tous les chiffres sont britanniques/européens ; la culture des jardins communautaires aux États-Unis est moins ancrée, les listes d'attente plus courtes, et les normes de durée d'occupation des parcelles diffèrent — une transposition directe des taux n'est pas appropriée. CONTRAINTES D'ACCÈS SUR L'INACTION : contrairement à la plupart des décisions de cet ensemble de données, le choix d'inaction est fréquemment involontaire — plus de 174 000 personnes figurent sur des listes d'attente britanniques avec des délais moyens de 4 ans et jusqu'à 12 ans dans certains arrondissements de Londres. Une partie du groupe « inaction » agirait si l'offre le permettait, ce qui complique le cadre de Gilovich qui suppose que l'inaction a été librement choisie.