Calidad de la evidencia 4.63/5
Puntuación de revisión en ocho dimensiones según la rúbrica de calidad . Cada dimensión puntuada de 1 a 5.
- D1 Anclaje en las fuentes
- 4/5
- D2 Autoridad de las fuentes
- 5/5
- D3 Aritmética
- 5/5
- D4 Incertidumbre
- 4/5
- D5 Alcance
- 5/5
- D6 Prosa
- 5/5
- D7 Honestidad sobre la percepción
- 4/5
- D8 Completitud de las advertencias
- 5/5
● tus factores — haz clic en este riesgo ▾ para revelar
- Tus factores
≈ Tan probable como
Percibido
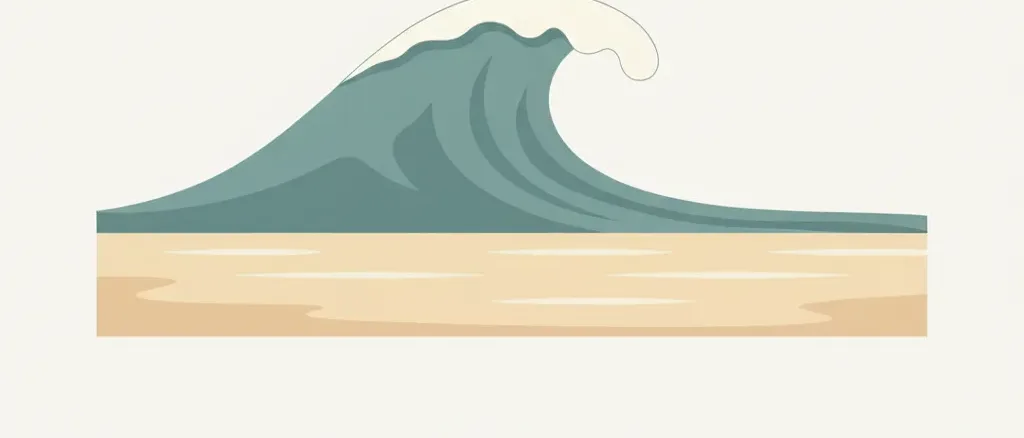
La imaginación popular tiende a cargar el peligro del océano sobre las imágenes más dramáticas: una ola gigante y anómala que barre un muelle, o un nadador debatiéndose contra un muro de olas. Los ataques de tiburón atraen una atención mediática desproporcionada pese a causar aproximadamente 1-2 muertes al año en EE. UU. El mecanismo dominante real del ahogamiento oceánico es invisible para la mayoría de los bañistas: un canal estrecho de agua que fluye hacia el mar llamado corriente de resaca, que puede arrastrar incluso a un nadador fuerte lejos de la orilla a velocidades superiores a los 8 pies por segundo. Una segunda población (personas de pie en la costa rocosa del Pacífico) muere por olas repentinas que llegan sin advertencia evidente. Ninguno de los dos mecanismos se parece al escenario hollywoodiense de desastre por olas, y ninguno se ve bien servido por la intuición de que «sé nadar, así que estoy bien».
Estimación aproximada: La mayoría de los bañistas subestima el riesgo de corrientes de resaca y sobrevalora los escenarios dramáticos de olas; los nadadores fuertes suelen sentirse inmunes
Fuente: intuición editorial, sin encuesta
Real
~150 muertes por ahogamiento en la zona de surf y el océano al año (EE. UU., excluida la navegación)
residentes de EE. UU., todas las edades, ahogamiento oceánico/en zona de surf no relacionado con embarcaciones
Mostrar cálculo
La base de datos de fatalidades en zona de surf del National Weather Service registró 99 muertes en zona de surf en 2025 (año completo confirmado) y un promedio a 10 años de aproximadamente 71/año (subconteo reconocido debido a clasificación errónea y casos no reportados). La estimación revisada por pares de NHESS Brewster et al. (2019), basada en datos de causa de rescate de la USLA de 1997-2016, concluye que más de 100 ahogamientos fatales al año son atribuibles solo a las corrientes de resaca. Sumando las muertes por oleaje alto y olas repentinas rastreadas por el NWS (~20-30/año) y los ahogamientos oceánicos que ocurren fuera de las áreas con cobertura de socorristas, una estimación central de ~150 muertes por ahogamiento en zona de surf y océano abierto al año es defendible como punto medio entre la cifra de subconteo reconocido del NWS (~71-99) y la extrapolación de límite superior de NHESS (~130-150 solo por corrientes de resaca). El ahogamiento relacionado con embarcaciones queda excluido (contabilizado en las estadísticas de navegación recreativa de la USCG). Aplicado a una población adulta estadounidense de ~258 millones con un horizonte de vida restante de 59 años: tasa anual = 150 / 258.000.000 = 5,81e-7; probabilidad a lo largo de la vida = 1-(1-5,81e-7)^59 ≈ 3,43e-5, o aproximadamente 1 de cada 29.000. Esta es una cifra de promedio poblacional; los bañistas, residentes costeros y nadadores oceánicos enfrentan tasas significativamente mayores, mientras que la mayoría de los adultos estadounidenses que rara vez o nunca acceden al oleaje oceánico enfrentan tasas menores. Use personal_factor_multipliers para la calibración.
Advertencias: La estimación central de ~150 muertes por ahogamiento oceánico/en zona de surf a…
La estimación central de ~150 muertes por ahogamiento oceánico/en zona de surf al año es una inferencia a partir de múltiples fuentes imperfectas, no una única cifra oficial. La base de datos de zona de surf del NWS (~71-99/año) se reconoce explícitamente como un subconteo; la estimación revisada por pares de NHESS (>100/año solo por corrientes de resaca) es una extrapolación a partir de las fracciones de causa de rescate de la USLA, no un censo directo de mortalidad. CDC WISQARS no publica una categoría CIE-10 limpia de «ahogamiento oceánico» separada de otros ahogamientos en aguas naturales; el desglose por tipo de masa de agua está disponible en la base de datos completa de WISQARS pero no se resume en las fichas informativas estándar de cara al público. El ahogamiento por embarcaciones queda excluido (véase la entrada recreational-boating-drowning). Las muertes por olas repentinas en las costas del Pacífico representan un mecanismo distinto que afecta a personas que no saben nadar y no deben confundirse con el ahogamiento en zona de surf. La cifra a lo largo de la vida se aplica a un promedio de la población adulta estadounidense; subestima sustancialmente el riesgo de cualquiera que entre regularmente en el oleaje oceánico.
Riesgos relacionados
Otros riesgos sobre temas similares — para explorar miedos relacionados.

Muerte haciendo snorkel
¿Cuáles son las probabilidades de morir haciendo snorkel en un viaje de vacaciones típico?


Ahogamiento en barco recreativo
¿Cuáles son las probabilidades de ahogarse tras caer por la borda de una embarcación de recreo o yate?

Sumersión de bebé en piscina
¿Cuáles son las probabilidades de una sumersión en piscina lo bastante grave como para necesitar atención de urgencia en un niño menor de 4 años?

Lesión medular por zambullida
¿Cuáles son las probabilidades de sufrir una lesión medular permanente al lanzarse de cabeza a aguas poco profundas o turbias?

Elige el contrincante
The dominant ocean-drowning mechanism in the United States is not a dramatic wave. It is a rip current: a narrow, fast-moving channel of water flowing seaward through a break in a sandbar or around a jetty. Rip currents account for roughly 80 percent of lifeguard rescues at US ocean beaches and, by the best peer-reviewed estimate, more than 100 drowning deaths per year in the United States (Brewster et al., 2019, Natural Hazards and Earth System Sciences). The NOAA National Weather Service surf-zone fatality database counted 99 deaths in 2025 across rip current, high surf, and sneaker-wave categories, and explicitly notes this figure is an undercount due to reporting gaps and misclassification. A reasonable central estimate for total non-boating ocean drowning deaths in the US is approximately 150 per year, producing a population-average lifetime probability of about 1 in 29,000 for a US adult. That is roughly 21 times rarer than all-cause drowning (~1 in 1,400 lifetime) and reflects the fact that most Americans have limited ocean exposure. For a regular surfer or ocean swimmer, the effective rate is meaningfully higher.
Sneaker waves represent a distinct and often underappreciated mechanism. On the Pacific Northwest and Northern California coastlines (Oregon, Washington, and the coast north of San Francisco), waves can arrive at shoreline viewpoints and rocky beaches with little warning, sweeping fully clothed, non-swimming visitors into cold water. The NWS attributes more West Coast deaths to sneaker waves than to all other combined weather hazards in those regions. The physics differs from surf-zone rip currents: the affected person is usually not attempting to swim, may be standing on rock or sand well above the waterline, and has no survival skill available once swept in. A peer-reviewed catalogue of sneaker-wave events on the Oregon and Northern California coast (García-Medina et al., 2018, Natural Hazards) covering 2005 through 2017 puts the associated death toll at more than 20. These deaths are geographically concentrated and affect a different population from the Florida and Gulf Coast drownings that dominate the national statistics.
What actually determines individual ocean drowning risk is a combination of exposure, behavior, and competence. At USLA-affiliated guarded beaches, the USLA calculates the per-visit drowning probability at 1 in 18 million, a number so small it reflects both the protective effect of lifeguards and the self-selection of people who go to managed beaches. At unguarded beaches the risk is approximately five times higher. Alcohol is the most consistently identified modifiable risk factor, present in up to 70 percent of adult recreational water deaths (CDC). Inability to swim or low water competency is the primary victim characteristic in rip-current drownings: roughly 40 million US adults cannot swim, and the transition from pool to ocean introduces currents, turbulence, and fatigue that pool competence does not prepare for. The standard rip current escape (swimming parallel to shore until clear of the seaward flow, then angling back at a diagonal) is not intuitive, is rarely rehearsed, and fails under panic or exhaustion. Knowing it reduces risk; following it under stress is the harder part.
Datos curiosos relacionados
Las probabilidades medias de que un adulto en EE. UU. se ahogue en la rompiente o en mar abierto son de cerca de 1 in 29,000 a lo largo de la vida. El mecanismo dominante es la corriente de retorno invisible, no la espectacular ola gigante, y los tiburones matan a alrededor de 1-2 personas al año en todo el país.
Registro de evidencia
Cada número a continuación es lo que reportó cada fuente, con la cita textual en la que nos basamos y cómo llegamos a nuestra cifra. Haz clic en cualquier enlace para verificarlo directamente.
2/4 fuentes verificadas de forma independiente palabra por palabra frente a la fuente citada
-
[1] NOAA National Weather Service — Surf Zone Fatalities in the United States: National Weather Service Verificado
Surf Zone Fatalities in the United States: National Weather Service- Estadística
99 surf-zone fatalities in 2025 (full year); 10-year NOAA average approximately 71/year; three tracked hazard categories: rip current, high surf, sneaker wave- Extracto
“"Rip currents cause a large percentage of the surf zone fatalities in the United States. Typically, a victim of a surf zone hazard is a male between the ages of 10-29, and most of the fatalities occur during the months of June and July and in the NWS Southern Region. Accurately tracking these types of fatalities is difficult because so many go unreported and undocumented." ”
- Datos de la fuente de
- 2025-12-31
- Accedido
- 2026-05-10 · copia archivada
- Verificación
- Extracto recuperado de forma independiente y confirmado palabra por palabra frente a la fuente citada durante nuestra auditoría de fundamentación.
- Cálculo
- NWS explicitly states the 10-year average (~71/year) is an undercount due to reporting gaps. The 2025 full-year total of 99 deaths across rip current, high surf, and sneaker wave categories is used as the lower-bound anchor. The NWS counts only deaths occurring in NWS forecast areas with surf-zone advisories; ocean drownings in unmonitored locations are excluded. The 99 figure ÷ 258M US adults = 3.84e-7 annual per-capita rate; lifetime (59 yr): 1-(1-3.84e-7)^59 ≈ 2.27e-5. Used as lower anchor; central estimate (~150/yr) reflects additional ocean drownings outside NWS coverage.
- Independencia
- NWS surf-zone fatality database draws from local NWS office incident reports, not from CDC NCHS death-certificate data. The two datasets are methodologically independent and serve as cross-checks; CDC records the manner of death and water-body type (partially), while NWS records the meteorological/oceanographic hazard type.
-
[2] Natural Hazards and Earth System Sciences (Copernicus / EGU) — Estimations of rip current rescues and drowning in the United States Verificado
Estimations of rip current rescues and drowning in the United States- Estadística
Rip currents account for 81.9% of rescues on US surf beaches (75.3% East Coast, 84.7% West Coast); estimated >100 fatal rip-current drownings per year in the United States- Extracto
“"Rip currents are the primary cause of 81.9% of rescues on surf beaches... Using this value as a proxy when examining overall surf beach drowning fatalities, it is suggested that more than 100 fatal drownings per year occur due to rip currents in the United States." ”
- Datos de la fuente de
- 2019-02-15
- Accedido
- 2026-05-10 · copia archivada
- Verificación
- Extracto recuperado de forma independiente y confirmado palabra por palabra frente a la fuente citada durante nuestra auditoría de fundamentación.
- Cálculo
- Brewster et al. (2019) analyzed USLA rescue-cause data from 1997-2016 (19-year series). Applying the 81.9% rip-current fraction to total US surf-beach drownings implies rip currents alone account for >100 deaths/year. This peer-reviewed estimate is the strongest single source for the rip-current component of ocean drowning mortality. Adding non-rip- current surf deaths (high surf, sneaker waves, shore-break) produces the ~150/yr central estimate used for the normalized figure. The USLA independently publishes the ~100/yr rip-current estimate on its rip current safety page, consistent with this study.
- Independencia
- Brewster et al. use USLA agency-reported rescue data, a different primary source than NWS incident reports or CDC death certificates. The three data streams (NWS, USLA/NHESS, CDC WISQARS) are methodologically independent and converge on an ocean/surf-zone drowning total in the 100-200/year range.
-
[3] United States Lifesaving Association — Rip Currents: United States Lifesaving Association
Rip Currents: United States Lifesaving Association- Estadística
Rip currents responsible for approximately 100 drownings per year in the US and over 80% of lifeguard rescues; USLA estimates 1-in-18-million drowning risk per beach visit at USLA-affiliated guarded beaches- Extracto
“"The United States Lifesaving Association estimates that rip currents are responsible for about 100 drownings each year in the United States. Rip currents account for over 80% of lifeguard rescues." ”
- Datos de la fuente de
- 2024-01-01
- Accedido
- 2026-05-10 · copia archivada
- Cálculo
- USLA's published 1-in-18-million per-visit figure (guarded beaches, 10-year average) is used as the protective lower bound. The USLA estimates 400M+ beach visits per year at affiliated guarded beaches. At 1 in 18M per visit, expected deaths = 400M / 18M ≈ 22/yr, which is the guarded-beach subset. USLA also states the risk is ~5x higher at unguarded beaches, yielding approximately 110/yr from the guarded+unguarded extrapolation, consistent with the NHESS >100 rip-current estimate. The ~100 rip-current figure from USLA is used as the primary rip-current estimate; the full ocean total of ~150/yr adds high surf and sneaker wave deaths tracked by NWS.
- Independencia
- USLA is the primary professional lifeguard standards organization; its rescue statistics are compiled from member agency reports, distinct from NWS weather-hazard reports and CDC mortality data.
-
[4] Natural Hazards (Springer) — García-Medina, Özkan-Haller, Ruggiero, Holman & Nicolini — Analysis and catalogue of sneaker waves in the US Pacific Northwest between 2005 and 2017
Analysis and catalogue of sneaker waves in the US Pacific Northwest between 2005 and 2017- Estadística
Peer-reviewed catalogue of sneaker-wave events on the Oregon and Northern California coast, 2005-2017; secondary reporting on the study puts the associated fatality count at approximately 29 over the period (15 Oregon, 14 Northern California)- Extracto
“"Sneaker waves are responsible for many casualties and beach rescues." ”
- Datos de la fuente de
- 2018-11-01
- Accedido
- 2026-07-03 · copia archivada
- Cálculo
- García-Medina et al. (2018) catalogue sneaker-wave events on the Oregon and Northern California coast from 2005-2017, classifying them by setting (structures, semi-enclosed beaches, open-coast beaches). The paper is the primary academic source for the sneaker-wave mechanism discussed in the body text; the ~29-fatality count (15 Oregon, 14 Northern California) cited in the body is drawn from secondary reporting on the study's findings, since the full peer-reviewed text sits behind a publisher paywall. Not used in the native/normalized ocean-drowning calculation, which relies on the NWS/NHESS/USLA figures above.
- Independencia
- Independent academic hazard-catalogue study (Oregon State University-affiliated authors), distinct from the NWS, NHESS/Brewster rip-current, and USLA sources used for the rest of this entry's ocean-drowning estimate.