Qualidade das evidências 4.63/5
Pontuação de revisão em oito dimensões segundo a grelha de qualidade . Cada dimensão pontuada de 1 a 5.
- D1 Ancoragem nas fontes
- 4/5
- D2 Autoridade das fontes
- 5/5
- D3 Aritmética
- 5/5
- D4 Incerteza
- 4/5
- D5 Âmbito
- 5/5
- D6 Prosa
- 5/5
- D7 Honestidade sobre a perceção
- 4/5
- D8 Completude das ressalvas
- 5/5
● seus fatores — clique neste risco ▾ para revelar
- Os seus fatores
≈ Tão provável quanto
Percebido
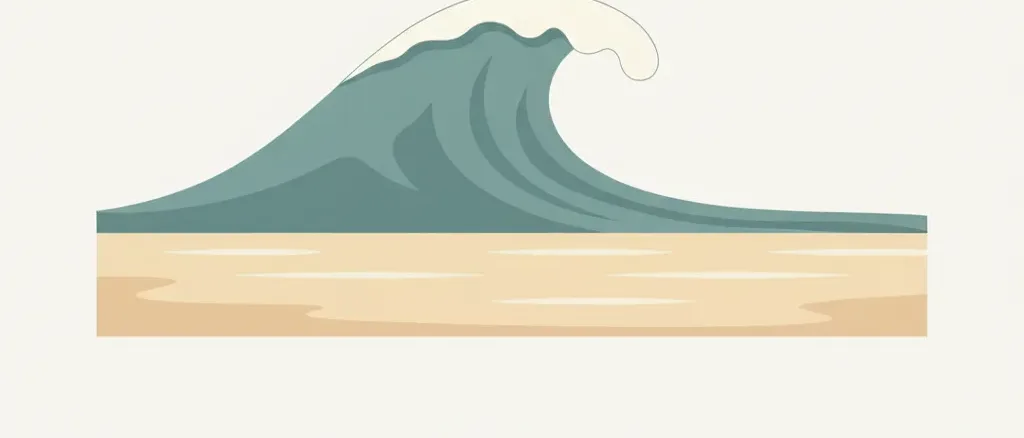
A imaginação pública tende a associar o perigo do oceano às imagens mais dramáticas: uma onda gigante e anómala a varrer um cais, ou um nadador a debater-se contra uma parede de rebentação. Os ataques de tubarão atraem atenção mediática desproporcionada apesar de causarem cerca de 1-2 mortes por ano nos EUA. O mecanismo dominante real de afogamento no oceano é invisível para a maioria dos banhistas: um canal estreito de água que flui em direção ao mar, chamado corrente de retorno, que pode arrastar mesmo um nadador forte para longe da costa a velocidades superiores a 8 pés por segundo. Uma segunda população (pessoas de pé na costa rochosa do Pacífico) morre devido a ondas traiçoeiras (sneaker waves) que chegam sem aviso óbvio. Nenhum dos mecanismos se parece com o cenário de catástrofe de ondas de Hollywood, e nenhum é bem servido pela intuição de que «sei nadar, por isso estou seguro».
Estimativa aproximada: A maioria dos banhistas subestima o risco de correntes de retorno e sobrevaloriza cenários dramáticos de ondas; os nadadores fortes sentem-se muitas vezes imunes
Fonte: intuição editorial, não pesquisado
Real
~150 mortes por afogamento na zona de arrebentação e no oceano por ano (EUA, excluindo embarcações)
Residentes dos EUA, todas as idades, afogamento no oceano/zona de arrebentação não relacionado com embarcações
Mostrar cálculo
A base de dados de fatalidades na zona de arrebentação do National Weather Service registou 99 mortes na zona de arrebentação em 2025 (ano completo confirmado) e uma média a 10 anos de aproximadamente 71/ano (subcontagem reconhecida devido a classificação incorreta e casos não reportados). A estimativa revista por pares do NHESS de Brewster et al. (2019), baseada em dados de causas de resgate da USLA de 1997-2016, conclui que mais de 100 afogamentos fatais por ano são atribuíveis apenas a correntes de retorno. Adicionando as mortes por rebentação alta e ondas traiçoeiras acompanhadas pelo NWS (~20-30/ano) e os afogamentos no oceano que ocorrem fora das áreas cobertas por nadadores-salvadores, uma estimativa central de ~150 mortes por afogamento na zona de arrebentação e no oceano aberto por ano é defensável como ponto médio entre o valor de subcontagem reconhecida do NWS (~71-99) e a extrapolação de limite superior do NHESS (~130-150 apenas para correntes de retorno). O afogamento relacionado com embarcações é excluído (contabilizado nas estatísticas de navegação recreativa da USCG). Aplicado a uma população adulta dos EUA de ~258 milhões com um horizonte de vida restante de 59 anos: taxa anual = 150 / 258 000 000 = 5,81e-7; probabilidade ao longo da vida = 1-(1-5,81e-7)^59 ≈ 3,43e-5, ou cerca de 1 em 29 000. Este é um valor médio da população; os banhistas, os residentes costeiros e os nadadores oceânicos enfrentam taxas significativamente mais altas, enquanto a maioria dos adultos americanos que raramente ou nunca acedem à rebentação oceânica enfrenta taxas mais baixas. Use personal_factor_multipliers para calibração.
Ressalvas: A estimativa central de ~150 mortes por afogamento no oceano/zona de arrebentaçã…
A estimativa central de ~150 mortes por afogamento no oceano/zona de arrebentação por ano é uma inferência a partir de várias fontes imperfeitas, não um único valor oficial. A base de dados da zona de arrebentação do NWS (~71-99/ano) é explicitamente reconhecida como uma subcontagem; a estimativa revista por pares do NHESS (>100/ano apenas para correntes de retorno) é uma extrapolação a partir das frações de causas de resgate da USLA, e não um censo direto de mortalidade. O CDC WISQARS não publica uma categoria ICD-10 clara de «afogamento no oceano» separada de outros afogamentos em águas naturais; a divisão por tipo de massa de água está disponível na base de dados WISQARS completa, mas não é resumida nas fichas informativas padrão destinadas ao público. O afogamento relacionado com embarcações é excluído (ver a entrada recreational-boating-drowning). As mortes por ondas traiçoeiras nas costas do Pacífico representam um mecanismo separado que afeta não nadadores e não deve ser confundido com o afogamento na zona de arrebentação. O valor ao longo da vida aplica-se a uma média da população adulta dos EUA; subestima substancialmente o risco para quem entra regularmente na rebentação oceânica.
Riscos relacionados
Outros riscos sobre temas semelhantes — para explorar medos relacionados.

Morte ao fazer snorkeling
Quais são as probabilidades de morrer durante o snorkeling numa viagem de férias típica?


Afogamento em barco
Quais são as chances de se afogar após cair de um barco de recreio ou iate?

Submersão de criança em piscina
Quais são as chances de uma submersão em piscina grave o suficiente para exigir atendimento de emergência numa criança menor de 4 anos?

Lesão medular em mergulho
Quais são as chances de lesão medular permanente por mergulho de cabeça em águas rasas ou turvas?

Escolha o comparado
The dominant ocean-drowning mechanism in the United States is not a dramatic wave. It is a rip current: a narrow, fast-moving channel of water flowing seaward through a break in a sandbar or around a jetty. Rip currents account for roughly 80 percent of lifeguard rescues at US ocean beaches and, by the best peer-reviewed estimate, more than 100 drowning deaths per year in the United States (Brewster et al., 2019, Natural Hazards and Earth System Sciences). The NOAA National Weather Service surf-zone fatality database counted 99 deaths in 2025 across rip current, high surf, and sneaker-wave categories, and explicitly notes this figure is an undercount due to reporting gaps and misclassification. A reasonable central estimate for total non-boating ocean drowning deaths in the US is approximately 150 per year, producing a population-average lifetime probability of about 1 in 29,000 for a US adult. That is roughly 21 times rarer than all-cause drowning (~1 in 1,400 lifetime) and reflects the fact that most Americans have limited ocean exposure. For a regular surfer or ocean swimmer, the effective rate is meaningfully higher.
Sneaker waves represent a distinct and often underappreciated mechanism. On the Pacific Northwest and Northern California coastlines (Oregon, Washington, and the coast north of San Francisco), waves can arrive at shoreline viewpoints and rocky beaches with little warning, sweeping fully clothed, non-swimming visitors into cold water. The NWS attributes more West Coast deaths to sneaker waves than to all other combined weather hazards in those regions. The physics differs from surf-zone rip currents: the affected person is usually not attempting to swim, may be standing on rock or sand well above the waterline, and has no survival skill available once swept in. A peer-reviewed catalogue of sneaker-wave events on the Oregon and Northern California coast (García-Medina et al., 2018, Natural Hazards) covering 2005 through 2017 puts the associated death toll at more than 20. These deaths are geographically concentrated and affect a different population from the Florida and Gulf Coast drownings that dominate the national statistics.
What actually determines individual ocean drowning risk is a combination of exposure, behavior, and competence. At USLA-affiliated guarded beaches, the USLA calculates the per-visit drowning probability at 1 in 18 million, a number so small it reflects both the protective effect of lifeguards and the self-selection of people who go to managed beaches. At unguarded beaches the risk is approximately five times higher. Alcohol is the most consistently identified modifiable risk factor, present in up to 70 percent of adult recreational water deaths (CDC). Inability to swim or low water competency is the primary victim characteristic in rip-current drownings: roughly 40 million US adults cannot swim, and the transition from pool to ocean introduces currents, turbulence, and fatigue that pool competence does not prepare for. The standard rip current escape (swimming parallel to shore until clear of the seaward flow, then angling back at a diagonal) is not intuitive, is rarely rehearsed, and fails under panic or exhaustion. Knowing it reduces risk; following it under stress is the harder part.
Curiosidades relacionadas
As probabilidades médias de um adulto nos EUA se afogar na arrebentação ou em mar aberto são de cerca de 1 in 29,000 ao longo da vida. O mecanismo dominante é a corrente de retorno invisível, não a dramática onda gigante, e os tubarões matam cerca de 1-2 pessoas por ano em todo o país.
Registro de evidências
Cada número abaixo é o que cada fonte relatou, com a citação literal em que nos baseamos e como chegamos ao nosso valor. Clique em qualquer link para verificar diretamente.
2/4 fontes verificadas de forma independente palavra por palavra em relação à fonte citada
-
[1] NOAA National Weather Service — Surf Zone Fatalities in the United States: National Weather Service Verificado
Surf Zone Fatalities in the United States: National Weather Service- Estatística
99 surf-zone fatalities in 2025 (full year); 10-year NOAA average approximately 71/year; three tracked hazard categories: rip current, high surf, sneaker wave- Trecho
“"Rip currents cause a large percentage of the surf zone fatalities in the United States. Typically, a victim of a surf zone hazard is a male between the ages of 10-29, and most of the fatalities occur during the months of June and July and in the NWS Southern Region. Accurately tracking these types of fatalities is difficult because so many go unreported and undocumented." ”
- Dados da fonte de
- 2025-12-31
- Acessado
- 2026-05-10 · cópia arquivada
- Verificação
- Trecho obtido novamente de forma independente e confirmado palavra por palavra em relação à fonte citada durante nossa auditoria de fundamentação.
- Cálculo
- NWS explicitly states the 10-year average (~71/year) is an undercount due to reporting gaps. The 2025 full-year total of 99 deaths across rip current, high surf, and sneaker wave categories is used as the lower-bound anchor. The NWS counts only deaths occurring in NWS forecast areas with surf-zone advisories; ocean drownings in unmonitored locations are excluded. The 99 figure ÷ 258M US adults = 3.84e-7 annual per-capita rate; lifetime (59 yr): 1-(1-3.84e-7)^59 ≈ 2.27e-5. Used as lower anchor; central estimate (~150/yr) reflects additional ocean drownings outside NWS coverage.
- Independência
- NWS surf-zone fatality database draws from local NWS office incident reports, not from CDC NCHS death-certificate data. The two datasets are methodologically independent and serve as cross-checks; CDC records the manner of death and water-body type (partially), while NWS records the meteorological/oceanographic hazard type.
-
[2] Natural Hazards and Earth System Sciences (Copernicus / EGU) — Estimations of rip current rescues and drowning in the United States Verificado
Estimations of rip current rescues and drowning in the United States- Estatística
Rip currents account for 81.9% of rescues on US surf beaches (75.3% East Coast, 84.7% West Coast); estimated >100 fatal rip-current drownings per year in the United States- Trecho
“"Rip currents are the primary cause of 81.9% of rescues on surf beaches... Using this value as a proxy when examining overall surf beach drowning fatalities, it is suggested that more than 100 fatal drownings per year occur due to rip currents in the United States." ”
- Dados da fonte de
- 2019-02-15
- Acessado
- 2026-05-10 · cópia arquivada
- Verificação
- Trecho obtido novamente de forma independente e confirmado palavra por palavra em relação à fonte citada durante nossa auditoria de fundamentação.
- Cálculo
- Brewster et al. (2019) analyzed USLA rescue-cause data from 1997-2016 (19-year series). Applying the 81.9% rip-current fraction to total US surf-beach drownings implies rip currents alone account for >100 deaths/year. This peer-reviewed estimate is the strongest single source for the rip-current component of ocean drowning mortality. Adding non-rip- current surf deaths (high surf, sneaker waves, shore-break) produces the ~150/yr central estimate used for the normalized figure. The USLA independently publishes the ~100/yr rip-current estimate on its rip current safety page, consistent with this study.
- Independência
- Brewster et al. use USLA agency-reported rescue data, a different primary source than NWS incident reports or CDC death certificates. The three data streams (NWS, USLA/NHESS, CDC WISQARS) are methodologically independent and converge on an ocean/surf-zone drowning total in the 100-200/year range.
-
[3] United States Lifesaving Association — Rip Currents: United States Lifesaving Association
Rip Currents: United States Lifesaving Association- Estatística
Rip currents responsible for approximately 100 drownings per year in the US and over 80% of lifeguard rescues; USLA estimates 1-in-18-million drowning risk per beach visit at USLA-affiliated guarded beaches- Trecho
“"The United States Lifesaving Association estimates that rip currents are responsible for about 100 drownings each year in the United States. Rip currents account for over 80% of lifeguard rescues." ”
- Dados da fonte de
- 2024-01-01
- Acessado
- 2026-05-10 · cópia arquivada
- Cálculo
- USLA's published 1-in-18-million per-visit figure (guarded beaches, 10-year average) is used as the protective lower bound. The USLA estimates 400M+ beach visits per year at affiliated guarded beaches. At 1 in 18M per visit, expected deaths = 400M / 18M ≈ 22/yr, which is the guarded-beach subset. USLA also states the risk is ~5x higher at unguarded beaches, yielding approximately 110/yr from the guarded+unguarded extrapolation, consistent with the NHESS >100 rip-current estimate. The ~100 rip-current figure from USLA is used as the primary rip-current estimate; the full ocean total of ~150/yr adds high surf and sneaker wave deaths tracked by NWS.
- Independência
- USLA is the primary professional lifeguard standards organization; its rescue statistics are compiled from member agency reports, distinct from NWS weather-hazard reports and CDC mortality data.
-
[4] Natural Hazards (Springer) — García-Medina, Özkan-Haller, Ruggiero, Holman & Nicolini — Analysis and catalogue of sneaker waves in the US Pacific Northwest between 2005 and 2017
Analysis and catalogue of sneaker waves in the US Pacific Northwest between 2005 and 2017- Estatística
Peer-reviewed catalogue of sneaker-wave events on the Oregon and Northern California coast, 2005-2017; secondary reporting on the study puts the associated fatality count at approximately 29 over the period (15 Oregon, 14 Northern California)- Trecho
“"Sneaker waves are responsible for many casualties and beach rescues." ”
- Dados da fonte de
- 2018-11-01
- Acessado
- 2026-07-03 · cópia arquivada
- Cálculo
- García-Medina et al. (2018) catalogue sneaker-wave events on the Oregon and Northern California coast from 2005-2017, classifying them by setting (structures, semi-enclosed beaches, open-coast beaches). The paper is the primary academic source for the sneaker-wave mechanism discussed in the body text; the ~29-fatality count (15 Oregon, 14 Northern California) cited in the body is drawn from secondary reporting on the study's findings, since the full peer-reviewed text sits behind a publisher paywall. Not used in the native/normalized ocean-drowning calculation, which relies on the NWS/NHESS/USLA figures above.
- Independência
- Independent academic hazard-catalogue study (Oregon State University-affiliated authors), distinct from the NWS, NHESS/Brewster rip-current, and USLA sources used for the rest of this entry's ocean-drowning estimate.