証拠の質 4.75/5
8次元のレビュー評価。基準は 品質ルーブリック 。各次元は1〜5で評価。
- D1 出典への根拠
- 5/5
- D2 出典の権威性
- 5/5
- D3 算術
- 3/5
- D4 不確実性
- 5/5
- D5 範囲
- 5/5
- D6 文章
- 5/5
- D7 認識の誠実性
- 5/5
- D8 注意事項の完全性
- 5/5
認知リスク
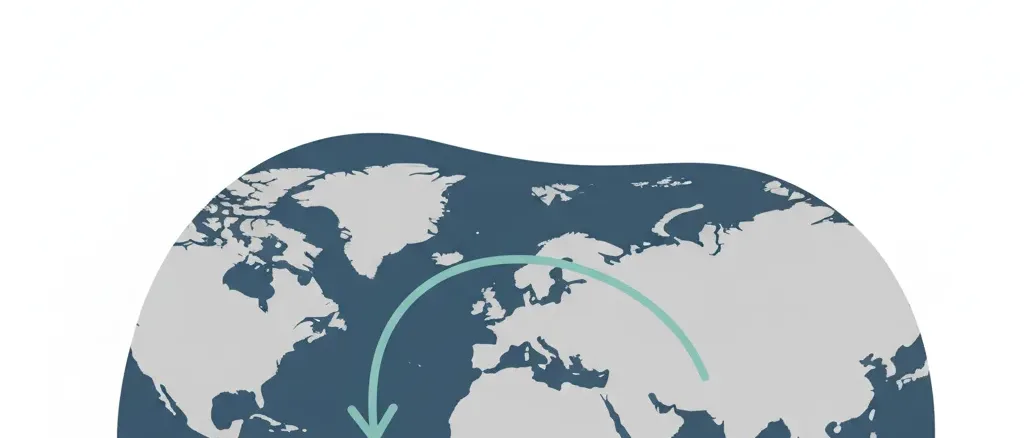
大西洋子午面循環(AMOC)は一般的な言葉ではなく、その潜在的な崩壊が主流の注目を集めるようになったのはごく最近のことである。一般向けの報道は、軽視(「科学者は海洋のコンベアベルトが減速していると言っている」)と破局論(瞬間的な凍結を描いたことが科学的フィクションであった映画『デイ・アフター・トゥモロー』を引き合いに出す見出し)の間で揺れ動く傾向がある。海洋循環のティッピングポイントという概念は、2021年のIPCC報告書の後、そして崩壊が世紀半ばに起こりうると予測した議論の多い2023年の論文の後に、より広く一般に認識されるようになった。チャップマン大学のアメリカ人の恐怖に関する調査は、AMOCの認知度を特に追跡していない。より広範な気候不安のデータでは、約48%のアメリカ人が地球温暖化と気候変動を恐れている、または非常に恐れていると報告しているが(チャップマン2024)、AMOCのような特定のティッピングポイントは分解されていない。このリスクは、積極的に恐れられているものと、ほとんど認識されていないものの間のどこかに位置している。
概算: 米国成人の約47.7%が、地球温暖化と気候変動全般について「恐れている」または「非常に恐れている」と報告している(チャップマン大学調査、第10波、2024年)——AMOCに特化した調査データは存在しない
実際のリスク
2100年より前にAMOCが急激に崩壊する確率は約5%(IPCC「可能性が非常に低い」= 0–10%、SROCC 2019 / AR6と整合的)
世界人口——AMOC崩壊は地球規模の出来事であり、人口別の確率はない
計算を表示
IPCC AR6 WG1(2021)は、AMOCが21世紀にわたり「可能性が非常に高い」形で減少すると評価し、「その減少が2100年より前に急激な崩壊を伴わないことに中程度の確信がある」とした。IPCC SROCC(2019)SPM(B.2.7)が、較正された「可能性が非常に低い(中程度の確信)」という尤度用語をAMOC崩壊に適用した評価である。IPCCの較正された表現では「可能性が非常に低い」= 0–10%の確率。この範囲の中央値として5%を用いたものが見出しの数値である。これは文明規模の出来事の確率であり、個人の死亡確率ではない。AMOC崩壊は誰かを即座に死なせるわけではないが、一連の帰結(欧州の冬季気温の5-15°Cの低下、米国東海岸での海面上昇の加速、熱帯降雨帯の混乱)を引き起こし、数十年にわたるその間接的な死亡は相当なものになるだろう。観測に基づく研究は著しく高い推定値を生む。Ditlevsen and Ditlevsen(2023、Nature Communications)は、海面水温の代理指標における統計的な早期警戒シグナルから、95% CIが2025-2095である中央崩壊時期2057を導き、50年の成人生涯のうちに>50%の確率を示唆した。Smolders et al.(2024)は、物理ベースの塩分指標を用いて、2050年より前のAMOC崩壊確率を59 ± 17%と推定した。両アプローチとも複数の上級海洋学者から方法論的な根拠で異議を唱えられており、2025年の34モデルアンサンブル研究(Baker et al.、Nature)は、試験されたすべての強制シナリオの下でAMOCが崩壊に対して頑健であることを見出した。広い不確実性の帯(1-40%)は、既知の分布をめぐる単なる統計的不確実性ではなく、この真の科学的な不一致を反映している。2025年の精緻化(2026-06-14追加)は、確率を解決することなくタイミングの問いを鋭くする。van Westen et al.(2025、JGR Oceans)は、SSP2-4.5の下で~2.5Cに近いティッピング閾値とともに、崩壊の開始を2063年(2026-2095、25th-57thパーセンタイル)近くに置き、一方Drijfhout et al.(2025、ERL)は、CMIP6の延長において、より早く確定した場合でも、完全な北部の転覆停止が2100年以降に50-100年かけて展開することを見出した。これらは中央の開始推定を狭め、開始対実現の区別を強化するが、いずれも公式機関による再評価ではないため、5%のIPCCに基づく見出しと1-40%の帯は変更せずに保持される。
注意事項: 5%という見出しは、IPCCの較正された「可能性が非常に低い」という表現(0-10%の確率、中程度の確信)に従っている——AMOC崩壊に対する「可能性が非常に低…
5%という見出しは、IPCCの較正された「可能性が非常に低い」という表現(0-10%の確率、中程度の確信)に従っている——AMOC崩壊に対する「可能性が非常に低い(中程度の確信)」という用語はIPCC SROCC(2019)SPM(B.2.7)に由来し、AR6 WG1(2021)はこれを「その減少が2100年より前に急激な崩壊を伴わないことに中程度の確信がある」と言い換えている。この見出しは、公表された推定値の全範囲ではなく、科学的コンセンサスのアンカーを表している。観測に基づく研究(Ditlevsen 2023、Smolders et al. 2024)は著しく高い推定値——世紀半ばまでの崩壊確率50-60%——を生むが、これらの手法は代理指標の代表性、時系列の長さ、モデルの仮定について異議を唱えられている。Baker et al. 2025の34モデルアンサンブル研究は、試験されたすべてのシナリオの下でAMOCの頑健性を主張し、IPCCの「可能性が非常に低い」という評価を支持している。科学的な議論は本当に未解決である。不確実性の帯(1-40%)は、既知のパラメータをめぐる単なる統計的不確実性ではなく、これを反映している。 この項目におけるAMOCの「崩壊」とは、すでに進行中の緩やかな弱化(現在「可能性が非常に高い」と評価されている)ではなく、劇的に弱まった状態への急激で自己持続的な減少を意味する。崩壊の帰結は一夜にしてではなく、数年から数十年にわたって展開するだろう。欧州の冬季気温は10-30年の時間スケールで5-15°C低下する可能性があり、米国東海岸の海面はベースライン予測より10-50 cm追加で上昇し、熱帯の降雨パターンは大きく変化するだろう。生涯の数値は、その帰結が対象となる成人の生涯のうちに完全に実現される確率ではなく、その出来事が引き起こされる確率である。 2025年の2つの研究は、見出しを動かすことなくタイミングを鋭くする。van Westen et al.(2025、JGR Oceans)は、25の気候モデルを分析し、中程度の排出シナリオの下でAMOC崩壊が2063年(範囲2026-2095)までに、高排出の下で2055年までに始まる可能性があり、ティッピング閾値が地球温暖化~2.5C近くにあると推定している——だが、いったん始まると、著しく弱まった状態に達するには100年以上かかることを強調している。Drijfhout et al.(2025、Environmental Research Letters)は、2100年を超えて延長されたCMIP6シミュレーションを検討し、北部深層転覆の完全な停止が、そこまで実行されたすべての高排出(SSP5-8.5)モデルで2100年以降に、そして中程度の排出モデルの37%で2300年までに現れることを見出した。これらは2023年の単一研究の警告に対して中央の開始推定を精緻化するが、上記のフレーミングを覆すのではなくむしろ強化する。世紀半ばの開始は、生きている成人の生涯のうちに完了する崩壊ではなく、確定であろう。
関連するリスク
似たテーマの他のリスク — 関連する不安を探るために。







比較対象を選択
The Atlantic Meridional Overturning Circulation is the vast network of ocean currents that transports warm surface water northward through the Atlantic and returns cold, deep water southward — the system responsible for northwestern Europe’s mild climate relative to its latitude. IPCC AR6 (2021) assessed that AMOC will “very likely” decline over the 21st century, with “medium confidence that the decline will not involve an abrupt collapse before 2100.” The earlier IPCC SROCC (2019) is the assessment that applied the calibrated “very unlikely (medium confidence)” likelihood term to an AMOC collapse — where “very unlikely” denotes a 0-10% probability. Using the midpoint of that calibrated range gives a ~5% lifetime probability of abrupt collapse before 2100. Caesar and colleagues (2018, Nature) documented that AMOC has already weakened by approximately 15% since the mid-twentieth century, using an independent sea-surface temperature fingerprinting approach that is consistent with RAPID array direct measurements begun in 2004.
The scientific debate is unusually polarised. Observation-based early-warning studies (Boers 2021, Nature Climate Change; Ditlevsen 2023, Nature Communications; van Westen 2024, Science Advances) identify statistical and physical signals consistent with AMOC approaching a tipping threshold, with Ditlevsen’s contested analysis predicting collapse most likely between 2025 and 2095. These findings imply a much higher probability than the IPCC consensus — in some estimates, 50-60% before mid-century. The counterargument came in February 2025 from Baker et al. (Nature), whose 34-model ensemble found AMOC resilient to collapse under all tested forcing scenarios, with Southern Ocean wind-driven upwelling sustaining the circulation even under extreme greenhouse gas concentrations. The IPCC’s “very unlikely” assessment rests primarily on this model-ensemble evidence. Both camps are publishing in leading peer-reviewed journals; the discrepancy is not a matter of one side being wrong in an obvious way.
Should AMOC collapse occur, the consequences within the following few decades would be substantial. Van Westen et al.’s consequence modelling projects European winter temperature drops of 5-15°C across northwestern Europe, with London’s average winter temperature falling from roughly 7°C to near 2°C and Oslo’s to well below -10°C. Sea level on the US East Coast would rise by an additional 10-50 cm above baseline sea level rise projections, as the ocean surface that AMOC currently depresses would rebound northward. The Amazon rainforest would face additional drying as tropical rainfall patterns shift. These are not immediate effects but decadal-to-century timescale consequences of a threshold crossing that, if it occurs, would likely be irreversible on any timescale relevant to human planning.
関連する豆知識
IPCC AR6 は2100年までのAMOCの急激な崩壊を「可能性が非常に低い」とし、確率はおよそ 5 percent としています。観測に基づく複数の研究はそれより高いと主張しており、不確実性の幅は広いままです。
根拠台帳
以下の各数値は各出典が報告した内容であり、引用した原文の抜粋と算出方法を記載しています。リンクをクリックして直接確認できます。
-
[1] Intergovernmental Panel on Climate Change (IPCC), Working Group I, Sixth Assessment Report — Climate Change 2021: The Physical Science Basis — Chapter 9: Ocean, Cryosphere and Sea Level Change
Climate Change 2021: The Physical Science Basis — Chapter 9: Ocean, Cryosphere and Sea Level ChangeSee all 2 Likelier entries citing this source →
- 統計値
AMOC will 'very likely' decline over the 21st century for all SSP scenarios; there is 'medium confidence' that the decline will not involve an abrupt collapse before 2100- 抜粋
“"The Atlantic Meridional Overturning Circulation (AMOC) will very likely decline over the 21st century for all SSP scenarios. There is medium confidence that the decline will not involve an abrupt collapse before 2100." ”
- 出典データ
- 2021-08-09
- アクセス日
- 2026-05-09 · アーカイブ版
- 計算過程
- AR6 WG1 Ch9 does not itself assign a numerical probability, nor does it use the "very unlikely" likelihood term for AMOC collapse — it states only "medium confidence that the decline will not involve an abrupt collapse before 2100." The "very unlikely (medium confidence)" characterization of an AMOC collapse is the IPCC SROCC (2019) SPM B.2.7 assessment (see the SROCC source below), which AR6 Ch9 is consistent with. Under the IPCC calibrated-language scale "very unlikely" = 0-10% probability; 5% is taken as the midpoint of that SROCC-defined range for the headline. The IPCC does not give a numerical probability; 5% is the author's interpretation of the calibrated-language midpoint. The 59-year adult lifetime window (age 18 to 77) maps roughly onto the "before 2100" horizon.
-
[2] Intergovernmental Panel on Climate Change (IPCC), SROCC 2019 — Special Report on the Ocean and Cryosphere in a Changing Climate — Summary for Policymakers (section B.2.7)
Special Report on the Ocean and Cryosphere in a Changing Climate — Summary for Policymakers (section B.2.7)- 統計値
AMOC is projected to weaken in the 21st century under all RCPs ('very likely'), although a collapse is 'very unlikely' (medium confidence)- 抜粋
“"The AMOC is projected to weaken in the 21st century under all RCPs (very likely), although a collapse is very unlikely (medium confidence)." ”
- 出典データ
- 2019-09-25
- アクセス日
- 2026-07-11 · アーカイブ版
- 計算過程
- This SROCC SPM statement (B.2.7) is the IPCC assessment that actually applies the "very unlikely (medium confidence)" likelihood term to an AMOC collapse. It is the grounding for the headline: under IPCC calibrated language "very unlikely" = 0-10% probability, and 5% is taken as the midpoint of that range. AR6 WG1 Ch9 (2021) restated this as "medium confidence that the decline will not involve an abrupt collapse before 2100," consistent with SROCC but without repeating the "very unlikely" term. Neither report gives a numerical probability; the 5% midpoint is the author's interpretation of the SROCC-stated calibrated-language range.
-
[3] Nature — Caesar, Rahmstorf et al., 2018 — Observed fingerprint of a weakening Atlantic Ocean overturning circulation
Observed fingerprint of a weakening Atlantic Ocean overturning circulation- 統計値
AMOC has weakened by approximately 3 ± 1 sverdrups (around 15%) since the mid-20th century, revealed by characteristic sea-surface temperature fingerprint- 抜粋
“"The AMOC has weakened by about 3 ± 1 sverdrups (around 15 per cent) since the mid-twentieth century, revealed by a characteristic spatial and seasonal sea-surface temperature 'fingerprint' — consisting of a pattern of cooling in the subpolar Atlantic Ocean and warming in the Gulf Stream region." ”
- 出典データ
- 2018-04-11
- アクセス日
- 2026-05-09 · アーカイブ版
- 計算過程
- Caesar et al. 2018 is the observational foundation for the AMOC weakening narrative. The 15% weakening since the mid-20th century is separate from the collapse-probability question — weakening and collapse are different states, and the IPCC projects continued weakening with high confidence even while assessing collapse as very unlikely. This source establishes that AMOC is not stable at its current state, providing the background against which collapse probability must be assessed.
- 独立性
- Caesar et al. use an independent SST-based fingerprinting approach developed separately from the RAPID array direct measurements (which began in 2004) and from the statistical early-warning methods of Boers 2021 and Ditlevsen 2023. The three methodologies corroborate each other on the weakening trend.
-
[4] Nature Communications — Ditlevsen and Ditlevsen, 2023 — Warning of a forthcoming collapse of the Atlantic meridional overturning circulation
Warning of a forthcoming collapse of the Atlantic meridional overturning circulation- 統計値
Statistical early-warning signals in SST proxies predict central AMOC collapse in 2057 (95% CI: 2025-2095); method is contested by multiple senior oceanographers- 抜粋
“"Data-driven estimators for the time of tipping predict a potential AMOC collapse mid-century under the current emission scenario, with a 95% confidence interval of 2025–2095." ”
- 出典データ
- 2023-07-25
- アクセス日
- 2026-05-09 · アーカイブ版
- 計算過程
- Ditlevsen 2023 derives its estimate from statistical early-warning signals (variance and autocorrelation growth) in North Atlantic SST proxies interpreted as fingerprints of approaching instability. The method is contested: Prof. Penny Holliday (National Oceanography Centre) stated "sea surface temperature of the North Atlantic subpolar gyre is not a clear indicator of the state of the AMOC"; Prof. Niklas Boers (TU Munich) argued "uncertainties in the heavily oversimplified model assumptions... are too high"; Dr. Levke Caesar (Univ. Bremen) stated "the resulting time series are too short." This source represents the upper bound of the scientific plausibility range and is not the headline figure, but it anchors the upper end of the uncertainty band.
- 独立性
- Ditlevsen 2023 is methodologically distinct from the IPCC's model-ensemble approach and from Caesar 2018's SST fingerprinting. It is included to represent the range of scientific opinion rather than as an independent confirmation of any single estimate.
-
[5] Science Advances — van Westen, Kliphuis and Dijkstra, 2024 — Physics-based early warning signal shows that AMOC is on tipping course
Physics-based early warning signal shows that AMOC is on tipping course- 統計値
Freshwater transport indicator (F_ovS) shows significant negative trend over past 40 years, consistent with AMOC approaching tipping point; European temperature drops of 5-15°C projected in collapse scenario- 抜粋
“"Reanalysis products indicate that the present-day AMOC is on route to tipping... Temperature trends exceed 1°C per decade across northwestern Europe during collapse." ”
- 出典データ
- 2024-02-09
- アクセス日
- 2026-05-09 · アーカイブ版
- 計算過程
- Van Westen 2024 uses a physics-based indicator (minimum of AMOC-induced freshwater transport, F_ovS) rather than statistical proxies. It finds a statistically significant negative trend of -1.20 mSv/year over the past 40 years, consistent with approach to tipping, but explicitly states inability to determine when tipping would occur. The consequence model run shows London's average winter temperature falling to ~1.9°C (from ~7°C today) and Oslo's to -16.5°C. These are consequences of full collapse, not of the current trajectory in isolation.
- 独立性
- Van Westen et al. use a different indicator (F_ovS from ocean reanalysis products) than Ditlevsen 2023 (SST statistical signals) or Caesar 2018 (SST fingerprinting), providing genuinely independent physics-based evidence for AMOC approaching instability.
-
[6] Nature — Baker et al. (Met Office and University of Exeter), 2025 — Continued Atlantic overturning circulation even under climate extremes
Continued Atlantic overturning circulation even under climate extremes- 統計値
34-model ensemble finds AMOC resilient to collapse under all tested greenhouse gas and freshwater forcing scenarios; Southern Ocean wind-driven upwelling sustains circulation- 抜粋
“"The AMOC is resilient to extreme greenhouse gas and North Atlantic freshwater forcings across 34 climate models." ”
- 出典データ
- 2025-02-19
- アクセス日
- 2026-05-09 · アーカイブ版
- 計算過程
- Baker et al. 2025 is the primary model-based counterargument. The 34-model ensemble finds that Southern Ocean upwelling — not captured in the observation-based early-warning studies — sustains AMOC circulation even under extreme forcing. This mechanism explains why most CMIP climate models do not show AMOC collapse this century, which IPCC AR6 uses as the primary basis for its "very unlikely" assessment. Baker 2025 is cited here as a materially important dissenting view that anchors the lower end of the uncertainty range. The discrepancy between the observation-based (Ditlevsen, Boers, van Westen) and model-based (Baker, IPCC) views is the fundamental unresolved debate in AMOC science.
- 独立性
- Baker et al. is methodologically opposed to the observation-based early-warning literature — it uses fully coupled climate models rather than statistical signals — and its conclusion directly contradicts the observation-based studies. Both methodologies are active areas of peer-reviewed research; neither has been refuted.
-
[7] Journal of Geophysical Research: Oceans — van Westen, Kliphuis and Dijkstra, 2025 — Physics-Based Indicators for the Onset of an AMOC Collapse Under Climate Change
Physics-Based Indicators for the Onset of an AMOC Collapse Under Climate Change- 統計値
25-model analysis estimates AMOC collapse could begin by 2063 (2026-2095, 25th-57th percentiles) under SSP2-4.5, or by 2055 (2023-2076) under SSP5-8.5; tipping threshold near ~2.5C global warming- 抜粋
“"An analysis consisting of 25 different climate models shows that the AMOC could begin to collapse by 2063 (from 2026 to 2095, 25th to 57th percentiles) under an intermediate emission scenario (SSP2-4.5), or by 2055 (from 2023 to 2076, 25th to 75th percentiles) under a high-end emission scenario (SSP5-8.5). When the AMOC collapses, the Northwestern European climate changes drastically and this will likely induce severe societal impacts." ”
- 出典データ
- 2025-08-24
- アクセス日
- 2026-06-14 · アーカイブ版
- 計算過程
- Van Westen et al. 2025 (JGR Oceans, Vol 130 Issue 8) develops a buoyancy-flux physics-based indicator for the ONSET of AMOC tipping — the moment the system becomes committed, not the moment a weakened state is reached. The paper's body places the multimodel-mean tipping threshold near ~2.5C of global warming above pre-industrial (the abstract states the onset years; the 2.5C / +2.48C figure is in the results text, paraphrased here, not in the verbatim excerpt). Critically, the paper states that once collapse begins it "takes more than 100 years to reach a substantially weaker state" — so a ~2063 onset under SSP2-4.5 describes a committed trajectory, not consequences realised within a focal adult's lifetime. This refines collapse TIMING relative to the contested 2023 single-study alarm but does not itself yield a numerical lifetime probability, so the 5% headline is unchanged; the result is recorded as a caveat and an assumptions addendum.
- 独立性
- Van Westen 2025 (JGR) uses a buoyancy-flux onset indicator across 25 CMIP-class models — distinct from both the SSP-extension shutdown framing of the 2025 ERL CMIP6 study and the F_ovS reanalysis indicator of van Westen 2024 (Science Advances). It sits between the observation-based alarm and the model-based resilience views.