証拠の質 4.63/5
8次元のレビュー評価。基準は 品質ルーブリック 。各次元は1〜5で評価。
- D1 出典への根拠
- 4/5
- D2 出典の権威性
- 5/5
- D3 算術
- 5/5
- D4 不確実性
- 4/5
- D5 範囲
- 5/5
- D6 文章
- 5/5
- D7 認識の誠実性
- 4/5
- D8 注意事項の完全性
- 5/5
● あなたの要因 — このリスクをクリック ▾ して表示
- あなたの要因
認知リスク
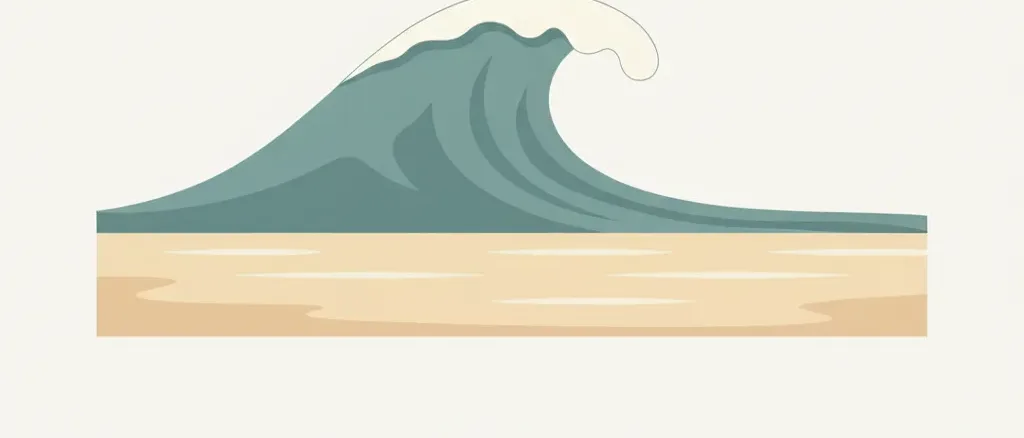
世間のイメージは、海の危険を最も劇的な光景に結びつけがちです。桟橋をさらう巨大な一発波や、押し寄せる波の壁にもがく泳者です。サメによる襲撃は、米国で年間およそ1~2人の死者しか出していないにもかかわらず、不釣り合いなほどメディアの注目を集めます。実際に最も多い海洋溺死のメカニズムは、多くの海水浴客の目には見えません。離岸流(リップカレント)と呼ばれる沖へ向かって流れる狭い水路で、屈強な泳者でさえ毎秒8フィートを超える速さで岸から引き離すことがあります。第二の集団(太平洋の岩場の海岸線に立つ人々)は、明白な予兆なく到来するスニーカーウェーブによって命を落とします。どちらのメカニズムもハリウッドの波の惨事のようには見えず、「泳げるから大丈夫」という直感ではどちらにも対処できません。
概算: 多くの海水浴客は離岸流のリスクを過小評価し、劇的な波のシナリオを過大評価している。屈強な泳者はしばしば自分は無縁だと感じている
出典: 編集部の直感(調査に基づかない)
実際のリスク
年間約150件のサーフゾーンおよび海洋での溺死(米国、ボート関連を除く)
米国居住者、全年齢、ボート関連を除く海洋/サーフゾーンでの溺死
計算を表示
米国気象局(National Weather Service)のサーフゾーン死亡データベースは、2025年に99件のサーフゾーン死亡(通年確定値)を記録し、10年平均は年間約71件です(誤分類や未報告の事例による過少計上が認められています)。査読済みのNHESS掲載のBrewsterら(2019)の推定は、1997~2016年のUSLA救助原因データに基づき、離岸流だけで年間100件を超える致命的な溺死が起因すると結論づけています。NWSが追跡する高波およびスニーカーウェーブによる死亡(年間約20~30件)と、ライフガードの管轄外で発生する海洋溺死を加えると、年間約150件のサーフゾーンおよび外洋での溺死という中心推定値は、過少計上が認められているNWSの数字(約71~99)と、上限であるNHESSの外挿(離岸流だけで約130~150)との中間値として妥当です。ボート関連の溺死は除外されています(USCGのレクリエーションボート統計に計上)。約258 millionの米国成人人口と59年の残存余命期間に適用すると、年間率=150 / 258,000,000=5.81e-7、生涯確率=1-(1-5.81e-7)^59≈3.43e-5、つまりおよそ29,000分の1です。これは人口平均の数字であり、海水浴客、沿岸住民、海で泳ぐ人はこれよりも著しく高い率に直面する一方、海のサーフにめったに、あるいは一度も近づかない大多数の米国成人はより低い率に直面します。較正にはpersonal_factor_multipliersを使用してください。
注意事項: 年間約150件の海洋/サーフゾーンでの溺死という中心推定値は、単一の公式な数字ではなく、複数の不完全な情報源からの推論です。NWSのサーフゾーンデータベース(年…
年間約150件の海洋/サーフゾーンでの溺死という中心推定値は、単一の公式な数字ではなく、複数の不完全な情報源からの推論です。NWSのサーフゾーンデータベース(年間約71~99)は過少計上であると明確に認められており、査読済みのNHESS推定(離岸流だけで年間100件超)は、直接的な死亡統計調査ではなくUSLAの救助原因の割合からの外挿です。CDC WISQARSは、他の自然水域での溺死とは別の明確な「海洋溺死」ICD-10カテゴリーを公表していません。水域の種類別の区分は完全なWISQARSデータベースでは利用可能ですが、標準的な一般向けファクトシートには要約されていません。ボートによる溺死は除外されています(recreational-boating-drowningの項目を参照)。太平洋沿岸のスニーカーウェーブによる死亡は、泳げない人に影響する別個のメカニズムを表しており、サーフゾーンでの溺死と混同すべきではありません。生涯確率は米国成人の人口平均に適用されるものであり、日常的に海のサーフに入る人のリスクは大幅に過小評価しています。
関連するリスク
似たテーマの他のリスク — 関連する不安を探るために。





比較対象を選択
The dominant ocean-drowning mechanism in the United States is not a dramatic wave. It is a rip current: a narrow, fast-moving channel of water flowing seaward through a break in a sandbar or around a jetty. Rip currents account for roughly 80 percent of lifeguard rescues at US ocean beaches and, by the best peer-reviewed estimate, more than 100 drowning deaths per year in the United States (Brewster et al., 2019, Natural Hazards and Earth System Sciences). The NOAA National Weather Service surf-zone fatality database counted 99 deaths in 2025 across rip current, high surf, and sneaker-wave categories, and explicitly notes this figure is an undercount due to reporting gaps and misclassification. A reasonable central estimate for total non-boating ocean drowning deaths in the US is approximately 150 per year, producing a population-average lifetime probability of about 1 in 29,000 for a US adult. That is roughly 21 times rarer than all-cause drowning (~1 in 1,400 lifetime) and reflects the fact that most Americans have limited ocean exposure. For a regular surfer or ocean swimmer, the effective rate is meaningfully higher.
Sneaker waves represent a distinct and often underappreciated mechanism. On the Pacific Northwest and Northern California coastlines (Oregon, Washington, and the coast north of San Francisco), waves can arrive at shoreline viewpoints and rocky beaches with little warning, sweeping fully clothed, non-swimming visitors into cold water. The NWS attributes more West Coast deaths to sneaker waves than to all other combined weather hazards in those regions. The physics differs from surf-zone rip currents: the affected person is usually not attempting to swim, may be standing on rock or sand well above the waterline, and has no survival skill available once swept in. A peer-reviewed catalogue of sneaker-wave events on the Oregon and Northern California coast (García-Medina et al., 2018, Natural Hazards) covering 2005 through 2017 puts the associated death toll at more than 20. These deaths are geographically concentrated and affect a different population from the Florida and Gulf Coast drownings that dominate the national statistics.
What actually determines individual ocean drowning risk is a combination of exposure, behavior, and competence. At USLA-affiliated guarded beaches, the USLA calculates the per-visit drowning probability at 1 in 18 million, a number so small it reflects both the protective effect of lifeguards and the self-selection of people who go to managed beaches. At unguarded beaches the risk is approximately five times higher. Alcohol is the most consistently identified modifiable risk factor, present in up to 70 percent of adult recreational water deaths (CDC). Inability to swim or low water competency is the primary victim characteristic in rip-current drownings: roughly 40 million US adults cannot swim, and the transition from pool to ocean introduces currents, turbulence, and fatigue that pool competence does not prepare for. The standard rip current escape (swimming parallel to shore until clear of the seaward flow, then angling back at a diagonal) is not intuitive, is rarely rehearsed, and fails under panic or exhaustion. Knowing it reduces risk; following it under stress is the harder part.
関連する豆知識
米国の成人が波打ち際や外洋で溺れる人口平均の生涯確率は約 1 in 29,000 です。主要な要因は劇的な巨大波ではなく目に見えない離岸流であり、サメによる死者は全国で年間およそ 1-2 人です。
根拠台帳
以下の各数値は各出典が報告した内容であり、引用した原文の抜粋と算出方法を記載しています。リンクをクリックして直接確認できます。
2/4 件の出典が引用元と一字一句一致することを独立して検証済み
-
[1] NOAA National Weather Service — Surf Zone Fatalities in the United States: National Weather Service 検証済み
Surf Zone Fatalities in the United States: National Weather Service- 統計値
99 surf-zone fatalities in 2025 (full year); 10-year NOAA average approximately 71/year; three tracked hazard categories: rip current, high surf, sneaker wave- 抜粋
“"Rip currents cause a large percentage of the surf zone fatalities in the United States. Typically, a victim of a surf zone hazard is a male between the ages of 10-29, and most of the fatalities occur during the months of June and July and in the NWS Southern Region. Accurately tracking these types of fatalities is difficult because so many go unreported and undocumented." ”
- 出典データ
- 2025-12-31
- アクセス日
- 2026-05-10 · アーカイブ版
- 検証
- グラウンディング監査の際、抜粋を引用元から独立して再取得し、原文と一字一句一致することを確認しました。
- 計算過程
- NWS explicitly states the 10-year average (~71/year) is an undercount due to reporting gaps. The 2025 full-year total of 99 deaths across rip current, high surf, and sneaker wave categories is used as the lower-bound anchor. The NWS counts only deaths occurring in NWS forecast areas with surf-zone advisories; ocean drownings in unmonitored locations are excluded. The 99 figure ÷ 258M US adults = 3.84e-7 annual per-capita rate; lifetime (59 yr): 1-(1-3.84e-7)^59 ≈ 2.27e-5. Used as lower anchor; central estimate (~150/yr) reflects additional ocean drownings outside NWS coverage.
- 独立性
- NWS surf-zone fatality database draws from local NWS office incident reports, not from CDC NCHS death-certificate data. The two datasets are methodologically independent and serve as cross-checks; CDC records the manner of death and water-body type (partially), while NWS records the meteorological/oceanographic hazard type.
-
[2] Natural Hazards and Earth System Sciences (Copernicus / EGU) — Estimations of rip current rescues and drowning in the United States 検証済み
Estimations of rip current rescues and drowning in the United States- 統計値
Rip currents account for 81.9% of rescues on US surf beaches (75.3% East Coast, 84.7% West Coast); estimated >100 fatal rip-current drownings per year in the United States- 抜粋
“"Rip currents are the primary cause of 81.9% of rescues on surf beaches... Using this value as a proxy when examining overall surf beach drowning fatalities, it is suggested that more than 100 fatal drownings per year occur due to rip currents in the United States." ”
- 出典データ
- 2019-02-15
- アクセス日
- 2026-05-10 · アーカイブ版
- 検証
- グラウンディング監査の際、抜粋を引用元から独立して再取得し、原文と一字一句一致することを確認しました。
- 計算過程
- Brewster et al. (2019) analyzed USLA rescue-cause data from 1997-2016 (19-year series). Applying the 81.9% rip-current fraction to total US surf-beach drownings implies rip currents alone account for >100 deaths/year. This peer-reviewed estimate is the strongest single source for the rip-current component of ocean drowning mortality. Adding non-rip- current surf deaths (high surf, sneaker waves, shore-break) produces the ~150/yr central estimate used for the normalized figure. The USLA independently publishes the ~100/yr rip-current estimate on its rip current safety page, consistent with this study.
- 独立性
- Brewster et al. use USLA agency-reported rescue data, a different primary source than NWS incident reports or CDC death certificates. The three data streams (NWS, USLA/NHESS, CDC WISQARS) are methodologically independent and converge on an ocean/surf-zone drowning total in the 100-200/year range.
-
[3] United States Lifesaving Association — Rip Currents: United States Lifesaving Association
Rip Currents: United States Lifesaving Association- 統計値
Rip currents responsible for approximately 100 drownings per year in the US and over 80% of lifeguard rescues; USLA estimates 1-in-18-million drowning risk per beach visit at USLA-affiliated guarded beaches- 抜粋
“"The United States Lifesaving Association estimates that rip currents are responsible for about 100 drownings each year in the United States. Rip currents account for over 80% of lifeguard rescues." ”
- 出典データ
- 2024-01-01
- アクセス日
- 2026-05-10 · アーカイブ版
- 計算過程
- USLA's published 1-in-18-million per-visit figure (guarded beaches, 10-year average) is used as the protective lower bound. The USLA estimates 400M+ beach visits per year at affiliated guarded beaches. At 1 in 18M per visit, expected deaths = 400M / 18M ≈ 22/yr, which is the guarded-beach subset. USLA also states the risk is ~5x higher at unguarded beaches, yielding approximately 110/yr from the guarded+unguarded extrapolation, consistent with the NHESS >100 rip-current estimate. The ~100 rip-current figure from USLA is used as the primary rip-current estimate; the full ocean total of ~150/yr adds high surf and sneaker wave deaths tracked by NWS.
- 独立性
- USLA is the primary professional lifeguard standards organization; its rescue statistics are compiled from member agency reports, distinct from NWS weather-hazard reports and CDC mortality data.
-
[4] Natural Hazards (Springer) — García-Medina, Özkan-Haller, Ruggiero, Holman & Nicolini — Analysis and catalogue of sneaker waves in the US Pacific Northwest between 2005 and 2017
Analysis and catalogue of sneaker waves in the US Pacific Northwest between 2005 and 2017- 統計値
Peer-reviewed catalogue of sneaker-wave events on the Oregon and Northern California coast, 2005-2017; secondary reporting on the study puts the associated fatality count at approximately 29 over the period (15 Oregon, 14 Northern California)- 抜粋
“"Sneaker waves are responsible for many casualties and beach rescues." ”
- 出典データ
- 2018-11-01
- アクセス日
- 2026-07-03 · アーカイブ版
- 計算過程
- García-Medina et al. (2018) catalogue sneaker-wave events on the Oregon and Northern California coast from 2005-2017, classifying them by setting (structures, semi-enclosed beaches, open-coast beaches). The paper is the primary academic source for the sneaker-wave mechanism discussed in the body text; the ~29-fatality count (15 Oregon, 14 Northern California) cited in the body is drawn from secondary reporting on the study's findings, since the full peer-reviewed text sits behind a publisher paywall. Not used in the native/normalized ocean-drowning calculation, which relies on the NWS/NHESS/USLA figures above.
- 独立性
- Independent academic hazard-catalogue study (Oregon State University-affiliated authors), distinct from the NWS, NHESS/Brewster rip-current, and USLA sources used for the rest of this entry's ocean-drowning estimate.