証拠の質 4.63/5
8次元のレビュー評価。基準は 品質ルーブリック 。各次元は1〜5で評価。
- D1 出典への根拠
- 4/5
- D2 出典の権威性
- 5/5
- D3 算術
- 5/5
- D4 不確実性
- 5/5
- D5 範囲
- 5/5
- D6 文章
- 4/5
- D7 認識の誠実性
- 4/5
- D8 注意事項の完全性
- 5/5
● あなたの要因 — このリスクをクリック ▾ して表示
- あなたの要因
≈ 同じくらいの確率
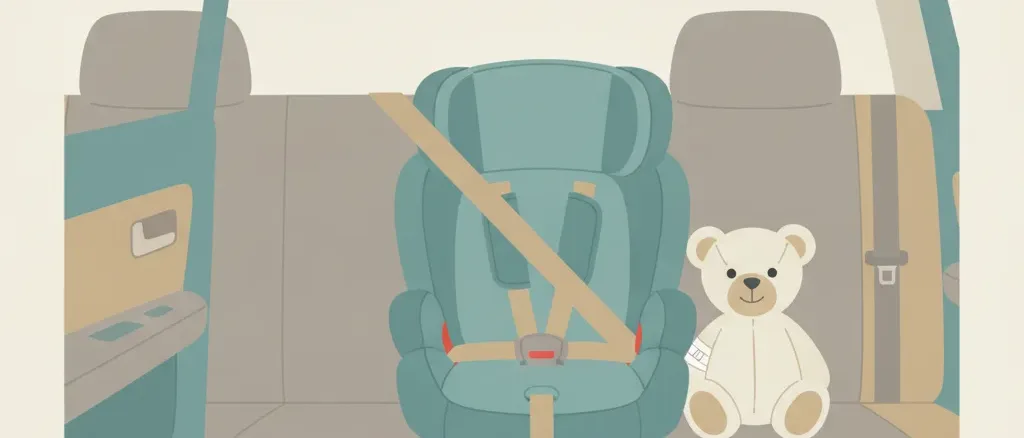
認知リスク
車に関する親の恐怖は死の枠組みと出来事の枠組みで動いている——飲酒運転者、壊滅的な高速道路事故——一方で、ふつうの乗車のふつうの負傷リスクはカテゴリーとしてほとんど認識されない。チャイルドシートのブランドや取り付けの細部に親が注ぐ膨大な注意は、そのシートが対抗している基礎確率の感覚をほとんど伴わない。子どもが事故でいつか怪我をする確率が千分の一なのか二十分の一なのか、答えられる親はほぼいない。実測の答え——14歳までで約27人に1人——は、これらの負傷の大部分が軽傷であるにもかかわらず、多くの人の予想より2番目の推測に近いところにある。
概算: ほとんどの親はこの確率を桁の範囲内でも言い当てられない;典型的な推測は実測の約27人に1人をはるかに下回る
出典: 編集部の直感(調査に基づかない)
実際のリスク
車両乗員として負傷する14歳以下の子どもは年間約14万7,000人(米国、2023年、導出値)
米国の14歳以下の子ども
計算を表示
NHTSAの「Children」ファクトシートは、2023年に14歳以下の子ども推定161,478人が交通事故で負傷し、うち7,081人が歩行者として、7,113人が自転車利用者として負傷したと報告している。この2つの非乗員区分を引くと147,284人が残る——車両に乗っていて負傷した子どもに、帰属されない少数のその他非乗員(スケートボード、キックスクーター利用者など)が加わったもので、これが分子に導出値のラベルが付く理由である。同じファクトシートの児童人口59,498,481人に対して、年間率は147,284 / 59,498,481 ≈ 年0.248%、約400人に1人。出生から14歳までの15年間で累積すると:1 − (1 − 0.00248)^15 ≈ 0.0365、約27人に1人。全人員区分の161,478人をそのまま使うと≈0.040(25人に1人)となり、これがバンドの上限;未報告の負傷はさらに押し上げ、CRSSの標本誤差と繰り返しの被害者は個人単位の確率を引き下げる。
注意事項: 分子はNHTSAが公表する単独の項目ではなく導出値である:ファクトシートの全交通での児童負傷161,478人から、名指しされた歩行者と自転車利用者の数を引いたも…
分子はNHTSAが公表する単独の項目ではなく導出値である:ファクトシートの全交通での児童負傷161,478人から、名指しされた歩行者と自転車利用者の数を引いたもので、残りは大部分が——だがすべてではなく——車両乗員である。数えられた負傷の大多数は軽傷であり、Durbinの衝突関与サンプルでは重傷を負った子どもは1.6%にすぎない。警察報告ベースのCRSS推定は未報告の負傷を見逃し、標本誤差を伴う。単年の率を15年間の子ども時代にわたって累積する計算は、2023年の率が続き各年が独立であることを仮定している;2回負傷した子どもは個人単位の確率では1回と数えられる。リスクは子ども時代を通じて、また世帯間で均一ではない——拘束装置の使用、誰が運転しているか、そして酩酊が集積する:2023年に死亡した1,019人の子どものうち25%はアルコール影響下運転の事故で死亡しており、ベルト非着用のドライバーは拘束されていない子どもを乗せている割合が不釣り合いに高い。死亡側の対応するレバーは拘束装置関連のエントリーで扱われる。
関連するリスク
似たテーマの他のリスク — 関連する不安を探るために。






比較対象を選択
親が実際に尋ねる問い——うちの子は車に乗っていて怪我をするだろうか——には知りうる答えがあるが、そこに誠実にたどり着くには一度の引き算が要る。NHTSAは2023年に14歳以下の子ども推定161,478人が交通事故で負傷したと数えた。この総数は車内の子どもと徒歩や自転車の子どもを混ぜている。負傷した児童歩行者7,081人と児童自転車利用者7,113人を除くと、車両に乗っていて負傷した約14万7,000人が残る。5,950万人の米国の子どもに対して、任意の単年でおよそ400人に1人、出生から14歳まで累積すると約27人に1人に達する。死亡側の対となる数字ははるかに小さい:2023年の児童交通死1,019人のうち770人が車両乗員で、負傷児童乗員は乗員死亡1人あたりおよそ190人となる(負傷は推定値、死亡は全数調査であるため、この比は桁の目安として扱うべきである)。
重症度の文脈がこの数字を誠実に保つ。負傷の等級付けを伴う最大の衝突関与児童サンプルでは、重傷の子どもは1.6%にすぎず、軽傷は13.5%だった——27人に1人という数字は打撲、ベルトによる擦過傷、むち打ち級の害が大半を占め、親の恐怖を駆動する壊滅的な帰結ではない。軽い尾部と重い尾部を分けるのは主として拘束の質である:拘束なしの子どもは適切に拘束された子どもの3.2倍の負傷オッズを、早すぎる大人用ベルトへの移行は1.8倍を、前席着座は拘束とは独立にさらに1.4倍を伴った。これらは死亡側のエントリーが測定するのと同じレバーである——拘束を完全に省く場合は拘束なし子供事故死、より微妙な誤用パターンは前向き幼児の死亡とダウンジャケット+チャイルドシートが扱う。
この導出には名指しする価値のある近道が1つある:NHTSAは乗員のみの児童負傷数を単独では公表していないため、ここでの分子は全交通の総数から名指しされた2つの非乗員区分を引いたものであり、スケートボードとキックスクーターの負傷がわずかに残っている。生の全交通数字をそのまま使えば25人に1人になる——「自動車事故での負傷」と「交通事故での負傷」の差は約10%であり、両者の混同こそ児童事故統計が誘う乗員対全交通の罠である。成人の確率が高いのは曝露が高いのと同じ理由による:全年齢の対となる自動車事故での負傷は年間約137人に1人と算出され、児童乗員の400人に1人と対照をなす——子どもは乗車マイルが少なく、ほぼ運転せず、より安全な後席に不釣り合いに多く座っている。
関連する豆知識
2023年、米国の交通事故は40,901人の命を奪い、推定244万人を負傷させた——死亡1件につき約60件の負傷(NHTSA)。生涯確率:死亡は約105人に1人、負傷は約2.6人に1人。14歳まで車に乗る子どもは約27人に1人。
根拠台帳
以下の各数値は各出典が報告した内容であり、引用した原文の抜粋と算出方法を記載しています。リンクをクリックして直接確認できます。
-
[1] National Highway Traffic Safety Administration (NHTSA) — Traffic Safety Facts 2023 Data: Children (DOT HS 813 712)
Traffic Safety Facts 2023 Data: Children (DOT HS 813 712)See all 2 Likelier entries citing this source →
- 統計値
2023: estimated 161,478 children (14 and younger) injured in traffic crashes (442/day); 7,081 injured as pedestrians and 7,113 as pedalcyclists; child population 59,498,481; 1,019 child traffic deaths of whom 770 (76%) were occupants; 25% of child deaths in alcohol-impaired-driving crashes- 抜粋
“"For the purpose of this fact sheet, children are defined as 14 years old and younger. [...] There were 59.5 million children in the United States, 18 percent of the total U.S. population. [...] An estimated 161,478 children were injured in traffic crashes in 2023, a 3-percent increase from 156,502 in 2022. An average of 3 children were killed and an estimated 442 children were injured every day in traffic crashes in 2023. [...] Figure 1 displays the distribution of the 1,019 child traffic fatalities in 2023—76 percent (770) were occupants and 24 percent (249) were nonoccupants (pedestrians, pedalcyclists, or other nonoccupants). [...] Of the estimated 68,244 pedestrians injured in traffic crashes, 10 percent (7,081) were children. [...] Of the estimated 49,989 pedalcyclists injured in traffic crashes, 14 percent (7,113) were children." ”
- 出典データ
- 2025-04-01
- アクセス日
- 2026-07-26 · アーカイブ版
- 計算過程
- Occupant-side numerator derived as 161,478 − 7,081 pedestrians − 7,113 pedalcyclists = 147,284. NHTSA does not publish a single occupant-only child injury count in this fact sheet; the remainder after removing the two named non-occupant person types is dominated by vehicle occupants but includes an unquantified sliver of other non-occupants. The child population denominator (59,498,481) is the fact sheet's own Table 7 US total, sourced to the Census Bureau. Note the trap this entry is built to avoid: child traffic totals mix occupants with pedestrians and cyclists, and using the all-traffic figure for an in-the-car question overstates the occupant risk by about 10 percent.
- 独立性
- Injury estimates come from NHTSA's Crash Report Sampling System (CRSS), a probability sample of police-reported crashes; fatality counts come from the FARS census; the population denominator is Census Bureau data.
-
[2] Durbin DR, Chen I, Smith R, Elliott MR, Winston FK — Pediatrics 115(3):e305-9 — Effects of seating position and appropriate restraint use on the risk of injury to children in motor vehicle crashes
Effects of seating position and appropriate restraint use on the risk of injury to children in motor vehicle crashes- 統計値
In a probability sample of 17,980 crash-involved children under 16 (representing 229,106 children), unrestrained children had OR 3.2 (95% CI 2.5-4.1) for injury vs appropriately restrained; inappropriately restrained OR 1.8 (1.4-2.3); front-seat OR 1.4 (1.2-1.7) vs rear- 抜粋
“"Inappropriately restrained children were at nearly twice the risk of injury, compared with appropriately restrained children (odds ratio [OR]: 1.8; 95% confidence interval [CI]: 1.4-2.3), whereas unrestrained children were at >3 times the risk (OR: 3.2; 95% CI: 2.5-4.1). [...] children in the front seat were at 40% greater risk of injury, compared with children in the rear seat (OR: 1.4; 95% CI: 1.2-1.7). [...] Age-appropriate restraint confers relatively more safety benefit than rear seating, but the 2 work synergistically." ”
- 出典データ
- 2005-03-01
- アクセス日
- 2026-07-26 · アーカイブ版
- 計算過程
- Source of all three restraint/seating multipliers. Injury basis (clinically significant injury, parent-reported on a validated instrument), per crash event, among crash-involved children under 16 in insured vehicles across 15 states, December 1998 - November 2002. Among crash-involved children in the sample, 1.6% had serious injuries and 13.5% minor injuries.
- 独立性
- Insurance-claims-based probability sample (State Farm / Partners for Child Passenger Safety), a wholly different data system from NHTSA's CRSS and FARS.
-
[3] Insurance Institute for Highway Safety (IIHS) — Fatality Facts 2022: Teenagers
Fatality Facts 2022: TeenagersSee all 2 Likelier entries citing this source →
- 統計値
Per mile driven, the fatal crash rate for drivers 16-19 is just over 3 times the rate for drivers 20 and older- 抜粋
“"The fatal crash rate per miles driven for 16-19 year-olds is just over 3 times the rate for drivers ages 20 and over." ”
- 出典データ
- 2024-05-01
- アクセス日
- 2026-07-26 · アーカイブ版
- 計算過程
- Basis for the teen-driver multiplier: a child passenger's crash exposure scales with the per-mile crash rate of whoever is driving. Fatal-crash basis used as a conservative proxy for all-severity crash involvement.
- 独立性
- IIHS rates derive from FARS counts and federal mileage surveys, independent of the CRSS injury estimates and the insurance-claims Durbin sample.