証拠の質 4.25/5
8次元のレビュー評価。基準は 品質ルーブリック 。各次元は1〜5で評価。
- D1 出典への根拠
- 4/5
- D2 出典の権威性
- 4/5
- D3 算術
- 4/5
- D4 不確実性
- 4/5
- D5 範囲
- 4/5
- D6 文章
- 5/5
- D7 認識の誠実性
- 4/5
- D8 注意事項の完全性
- 5/5
● あなたの要因 — このリスクをクリック ▾ して表示
- あなたの要因
認知リスク
突然の機械的故障への恐怖——坂道でブレーキが効かなくなる、高速道路でタイヤがバーストする——は鮮明で映画的である。車両検査プログラムは米国の約半数の州に存在し、その政治的な正当化は、未検査の車両が有意な事故リスクをもたらすという前提に基づいている。しかしNHTSAのNational Motor Vehicle Crash Causation Surveyは、車両関連の要因が決定的な原因となるのは事故の約2%にすぎず、運転手のミスが94%と大半を占めることを見出した。整備関連リスクに対する世間の認識は、データが裏付ける以上に高くなりがちである。これは一つには機械的故障による事故が不釣り合いに重篤であるため(高速走行中のブレーキ故障は、不注意による軽微な追突よりも致命的になりやすい)、また一つには検査プログラムの擁護者がリスクを強調する制度的な動機を持っているためである。
概算: 多くの運転手は、事故の5〜10%が車両の欠陥によって引き起こされていると想定している
出典: 編集部の直感(調査に基づかない)
実際のリスク
事故の約100件中2件で車両要因が決定的な原因として関与している
米国の小型車両の衝突事故(NMVCCS 2005-2007)
計算を表示
NHTSAのNMVCCSは、車両要因が事故の2%(年間約2.2 million件の事故のうち約44,000件)で決定的な原因であることを見出した。NHTSAは、整備関連の故障による死亡を年間約2,600人と推定している。平均的な米国の運転手は、59年間の運転を通じて少なくとも1件の警察報告された事故に遭う生涯確率が約77%である。2%の車両要因割合を適用すると、0.77 × 0.02 ≈ 0.015となる。「車両の決定的な原因」には、所有者が怠った整備に加えて製造上の欠陥やリコールも含まれることを踏まえ、やや保守的な中心推計値として0.012を用いる。この生涯の数値は、車両の整備または状態が主な原因であった事故に遭う確率を表す。
注意事項: NMVCCSによる2%という決定的原因の数値は、入手可能な中で最も厳密なものだが、2005-2007年のデータに基づいている。現代の車両にはより多くの電子安全シ…
NMVCCSによる2%という決定的原因の数値は、入手可能な中で最も厳密なものだが、2005-2007年のデータに基づいている。現代の車両にはより多くの電子安全システム(ABS、ESC、TPMS)が搭載されており、車両要因の割合を低下させた可能性がある。逆に、米国の道路を走る車両の平均車齢は約12.6年に上昇しており、これは反対方向に作用する。この項目は、車両の状態が主な原因であった事故を扱っており、それが寄与因子であった事故は含まない——後者の割合はより高くなるだろう。年間2,600人の死亡という数値は広く引用されているが、その正確な方法論は単一のNHTSA一次報告書には公表されていない。
関連するリスク
似たテーマの他のリスク — 関連する不安を探るために。







比較対象を選択
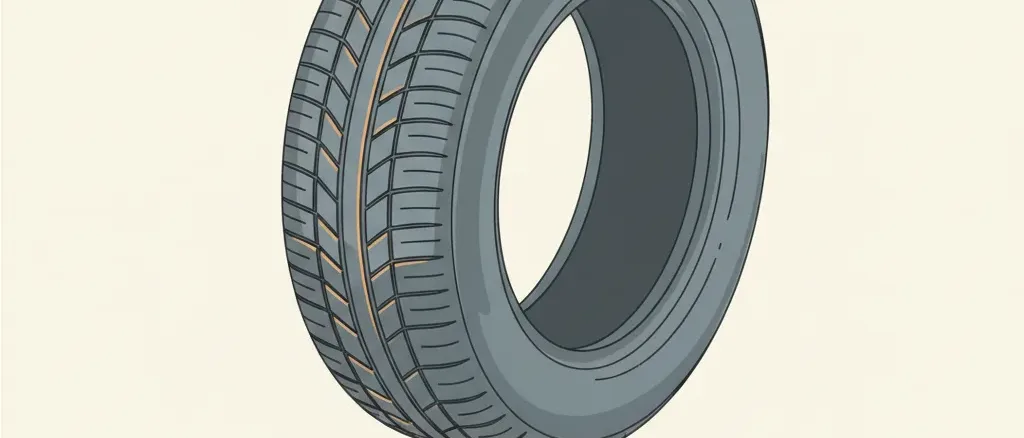
NHTSAの「National Motor Vehicle Crash Causation Survey」(衝突事故原因に関する同機関で最も詳細な現場調査)によると、車両関連の要因が、年間約220万件の警察報告された衝突事故のうち約44,000件、つまり約2%の事故において決定的な原因でした。運転手の行動が94%で決定的な原因であり、環境要因(路面、天候)が残りの4%を占めていました。車両要因による事故の中では、タイヤとホイールの故障が最も多く、次いでブレーキの劣化、ステアリングまたはサスペンションの問題が挙げられます。これらは圧倒的に整備上の問題であり、製造上の欠陥ではありません。
この2%という数字は、事故の重大性を考慮に入れるまでは軽視されがちです。整備不良に関連する事故は、不釣り合いに危険です。時速70マイルでのタイヤのバーストや下り坂でのブレーキ故障は、全体の事故件数を占める低速の軽微な追突事故よりも、より高エネルギーの衝突を引き起こします。NHTSAは、車両の整備不良が年間約2,600人の死亡を引き起こすと推定しています。これは、米国の年間約40,000人の交通事故死者数の約6.5%にあたり、事故件数における2%の割合の3倍以上です。車両の状態が主な原因となる事故に遭遇する生涯確率は約83分の1ですが、そのような事故で死亡する生涯確率は2,200分の1に近いです。
州の車両検査プログラムは政策的な対応ですが、その有効性には議論があります。米国の約半数の州では定期的な安全検査を義務付けていますが、残りの半数では義務付けていません。州ごとの事故発生率を比較した研究では、検査プログラムに起因する統計的に有意な差はわずかであるか、全く見られないことが判明しています。これは、検査が重要な欠陥の一部しか検出しないこと(一部の州では、溝の深さが2/32インチのタイヤが検査に合格するものの、雨天時には性能が著しく低下します)、そして2%という基本発生率では、プログラムの効果がノイズの中から現れる余地がほとんどないためです。最も効果的な整備介入策は、おそらくタイヤ空気圧監視システムでしょう。これは2007年以降、米国のすべての新車に義務付けられており、車両要因の単一最大カテゴリーに対処しています。
関連する豆知識
運転者は機械故障が事故の大半を招くと思いがちだが、車両要因が決定的原因となるのは ~2 in 100 件の事故のみ——個々の運転者では生涯で約 1 in 83。残りは運転行動が支配する。
根拠台帳
以下の各数値は各出典が報告した内容であり、引用した原文の抜粋と算出方法を記載しています。リンクをクリックして直接確認できます。
2/5 件の出典が引用元と一字一句一致することを独立して検証済み
-
[1] National Highway Traffic Safety Administration (NHTSA) — National Motor Vehicle Crash Causation Survey: Report to Congress
National Motor Vehicle Crash Causation Survey: Report to Congress- 統計値
Vehicle-related factors were the critical reason for the crash in approximately 2% of cases (44,000 of ~2.2 million crashes); tires, brakes, and steering/suspension were the leading vehicle factors- 抜粋
“"The critical reason was assigned to the vehicle in an estimated 44,000 crashes (2 percent). Among those, tire/wheel failure was the most frequently cited vehicle-related critical reason, followed by brake-related problems and steering/suspension/transmission/ engine-related failures." ”
- 出典データ
- 2008-07-01
- アクセス日
- 2026-04-18 · アーカイブ版
- 計算過程
- The NMVCCS is NHTSA's definitive crash-causation study, based on on-scene investigation of 5,470 crashes from 2005-2007 weighted to national estimates. "Critical reason" is defined as the immediate reason for the critical pre-crash event — the last failure in the causal chain. The 2% vehicle-factor figure includes both maintenance-related degradation (worn tires, failed brakes) and manufacturing defects. It does not mean vehicle condition was irrelevant in 98% of crashes — it means driver or environment was the proximate cause. Vehicle condition may have been a contributing factor in additional crashes without being the critical reason. The full critical-reason breakdown reported by NHTSA for the NMVCCS is: drivers 94% (±2.2%), vehicles 2% (±0.7%), environment (road surface, weather, etc.) 2% (±1.3%), and unknown/unattributed 2% (±1.4%).
-
[2] National Highway Traffic Safety Administration (NHTSA) — Tire-Related Factors in the Pre-Crash Phase
Tire-Related Factors in the Pre-Crash Phase- 統計値
Tire problems were present in ~5% of pre-crash vehicles; underinflation and inadequate tread depth were the leading tire-related factors- 抜粋
“"Of the estimated 3,889,770 vehicles involved in the NMVCCS crashes, 5 percent experienced tire problems in the pre-crash phase. ... A vehicle is more likely to experience tire problems when one or more tires are underinflated or the vehicle is running on tires with inadequate tread depth." ”
- 出典データ
- 2012-04-01
- アクセス日
- 2026-04-18 · アーカイブ版
- 計算過程
- This NHTSA technical report uses NMVCCS data to focus on tire-related factors. Tire problems being "present" in ~5% of pre-crash vehicles (5 percent of the estimated 3,889,770 crash-involved vehicles) is higher than the 2% critical-reason figure because a tire problem can be present without being the critical reason (e.g., a driver with low tire pressure rear-ends someone due to distraction — the tire was degraded but the driver was the critical reason). This distinction between "contributing factor" and "critical reason" matters for interpreting the 2% figure.
-
[3] Lowe Law Group (citing NHTSA data) — How Often Does Poor Maintenance Result In Car Accidents? 検証済み
How Often Does Poor Maintenance Result In Car Accidents?- 統計値
NHTSA estimates poor vehicle maintenance leads to approximately 2,600 deaths, 100,000 disabling injuries, and nearly $2 billion in losses annually- 抜粋
“"Research by NHTSA estimates that poor vehicle maintenance leads to approximately 2,600 deaths, 100,000 disabling injuries, and nearly $2 billion in lost wages, medical expenses, and property damage every year in the United States." ”
- 出典データ
- 2024-01-15
- アクセス日
- 2026-04-18 · アーカイブ版
- 検証
- グラウンディング監査の際、抜粋を引用元から独立して再取得し、原文と一字一句一致することを確認しました。
- 計算過程
- The 2,600 annual deaths figure, widely cited and attributed to NHTSA, provides the severity context. Against ~40,000 total US traffic fatalities per year, maintenance- related deaths account for ~6.5% of the total — higher than the 2% critical-reason share of all crashes because maintenance-related crashes skew more severe (tire blowouts at highway speed, brake failures on grades). Lifetime fatal risk from maintenance-caused crashes: 2,600/330M × 59 years ≈ ~1 in 2,200.
-
[4] U.S. Government Accountability Office (GAO) — Vehicle Safety Inspections: Improved DOT Communication Could Better Inform State Programs 検証済み
Vehicle Safety Inspections: Improved DOT Communication Could Better Inform State Programs- 統計値
Studies GAO reviewed and GAO's own analysis of state data found no clear influence of periodic vehicle-inspection programs on crash rates related to vehicle component failure- 抜粋
“"Studies GAO reviewed and GAO's analysis of state data examined the effect of inspection programs on crash rates related to vehicle component failure, but showed no clear influence." ”
- 出典データ
- 2015-08-01
- アクセス日
- 2026-07-04 · アーカイブ版
- 検証
- グラウンディング監査の際、抜粋を引用元から独立して再取得し、原文と一字一句一致することを確認しました。
- 計算過程
- GAO's 2015 report to Congress reviewed the available research on periodic passenger- vehicle safety inspection (PVSI) programs, including before/after crash data from New Jersey and Oklahoma after those states eliminated their inspection programs, and found no statistically demonstrable reduction in vehicle-component-failure crashes attributable to inspection programs. This is the basis for the body-text claim that studies comparing crash rates across inspecting and non-inspecting states have found no clear effect from the programs.
-
[5] National Highway Traffic Safety Administration (NHTSA) / Federal Register — Federal Motor Vehicle Safety Standards; Tire Pressure Monitoring Systems (Final Rule)
Federal Motor Vehicle Safety Standards; Tire Pressure Monitoring Systems (Final Rule)- 統計値
TPMS phase-in required 20% of light vehicles Oct 2005-Aug 2006, 70% Sept 2006-Aug 2007, and full compliance for all covered light vehicles by September 1, 2007- 抜粋
“"Vehicle manufacturers are not required to comply with the requirements related to the TPMS malfunction indicator (including associated owner's manual requirements) until September 1, 2007; however, at that point, all covered vehicles must meet all relevant requirements of the standard." ”
- 出典データ
- 2007-07-12
- アクセス日
- 2026-07-04 · アーカイブ版
- 計算過程
- FMVSS No. 138 implements the TREAD Act's tire-pressure-monitoring-system mandate. The phase-in schedule required 20% compliance for light vehicles manufactured October 2005 through August 2006, 70% for September 2006 through August 2007, and full compliance for all covered light vehicles (passenger cars and trucks under 10,000 lbs GVWR) manufactured on or after September 1, 2007. Grounds the body-text claim that TPMS has been mandated on all new US vehicles since 2007, addressing tire/wheel failure — the leading vehicle-factor crash category identified in the NMVCCS above.