証拠の質 4.63/5
8次元のレビュー評価。基準は 品質ルーブリック 。各次元は1〜5で評価。
- D1 出典への根拠
- 4/5
- D2 出典の権威性
- 5/5
- D3 算術
- 5/5
- D4 不確実性
- 5/5
- D5 範囲
- 5/5
- D6 文章
- 4/5
- D7 認識の誠実性
- 4/5
- D8 注意事項の完全性
- 5/5
● あなたの要因 — このリスクをクリック ▾ して表示
- あなたの要因
≈ 同じくらいの確率
認知リスク
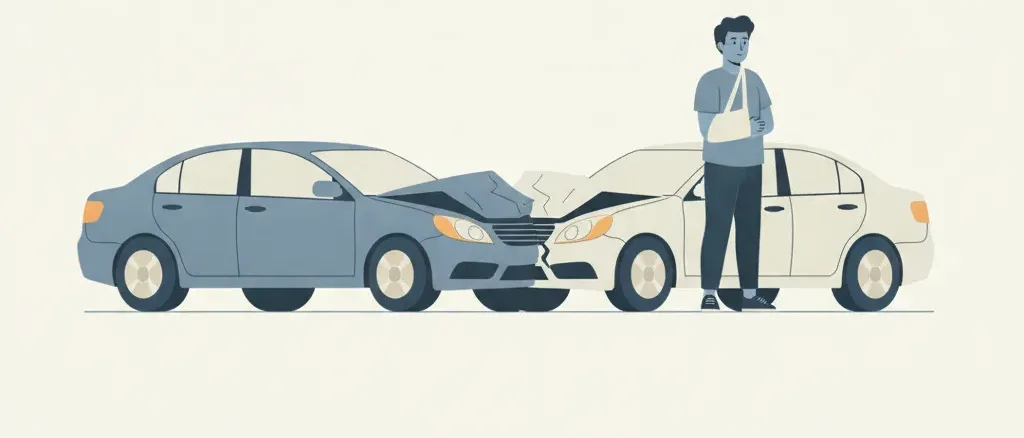
事故リスクの認識は死の枠組みで動いている。恐怖調査は事故で死ぬことや飲酒運転者にはねられることを尋ねるが、通勤中の手首骨折への恐れを調査する者はいない。一方、オプティミズムバイアスの研究文献は、ドライバーが自分を平均より安全だと評価し、自分の事故確率を集団全体より低く見積もることを一貫して示している。そのため負傷の数字——死亡の数字の60倍——は盲点に位置する:恐れるにはあまりに日常的で、推測するにはあまりに大きい。すでに軽い接触事故を経験した人は、それを基礎確率の現れではなく不運として片付ける傾向がある。
概算: ほとんどのドライバーは、生涯で事故負傷する確率を実測値の約3人に1人よりはるかに低く見積もるだろう
出典: 編集部の直感(調査に基づかない)
実際のリスク
警察報告済み交通事故での負傷者は年間約244万人(米国、2023年)
米国居住人口、全年齢
計算を表示
NHTSAの「Summary of Motor Vehicle Traffic Crashes」は、2023年に警察報告済み交通事故で推定2,442,581人が負傷したと報告している。本エントリーは米国成人の生涯確率に正規化されているため、子どもの分は分子・分母の両側から除かれる:NHTSAの「Children」ファクトシートは14歳以下の負傷児童を161,478人と数えており、残るのは2,442,581 − 161,478 = 2,281,103人の15歳以上の負傷者で、これを15歳以上人口334,914,895 − 59,498,481 = 275,416,414人(国勢調査局、2023年7月1日)に対置する。年間率は2,281,103 / 275,416,414 ≈ 年0.828%、約121人に1人。本サイト標準の残り成人期59年間で累積すると:1 − (1 − 0.00828)^59 ≈ 0.388、約2.6人に1人。(代わりに全年齢の生の率0.729%/年を使うと0.351——2.9人に1人——で妥当な範囲の下限となる;15〜17歳を「成人」側に含めることは、10代の事故率が高いため18歳以上の率をわずかに過大評価する。)相反する2つのバイアスが推定を挟み込む:同一人物が複数回負傷しうる(繰り返しの被害者は、個人単位の生涯確率を単純な累積計算より低くする)一方で、警察報告ベースの集計は警察に届け出られなかった負傷を見逃す(真の数字を押し上げる)。不確実性の幅は両方向をカバーする。
注意事項: 見出しの数字は、打撲やむち打ちから恒久的な障害まで、あらゆる重症度の警察報告済み負傷を数えている——重篤な部分は244万件のごく一部にすぎない。警察に報告されな…
見出しの数字は、打撲やむち打ちから恒久的な障害まで、あらゆる重症度の警察報告済み負傷を数えている——重篤な部分は244万件のごく一部にすぎない。警察に報告されなかった負傷(軽微な単独事故や低速の衝突では一般的)は完全に除外されているため、実際のあらゆる負傷の総数は警察報告ベースの推定より多い。年間平均を59年間にわたって累積する計算は、各年の独立性と平均的な曝露プロファイルを仮定している:運転も乗車もしない人はこの数字より低く、走行距離の多いドライバーは高くなり、また同一人物が複数回負傷しうるため、一度でも負傷したことのある人の割合は単純な累積計算が示唆するよりやや低い。CRSSの負傷件数は標本ベースの推定値であり、その標本誤差はNHTSAが別途報告している。
関連するリスク
似たテーマの他のリスク — 関連する不安を探るために。







比較対象を選択
死は自動車事故のまれな尾部であり、負傷こそが日常的な帰結である。2023年、米国では推定6,138,359件の警察報告済み事故が記録された。これらは40,901人の命を奪い、推定2,442,581人を負傷させた——死亡1件につき約60人が負傷し、毎分5人が負傷している計算になる。国勢調査局の3億3,490万人の居住者に分散させると、任意の1年で負傷者の1人になる確率はおよそ137人に1人。負傷児童161,478人と児童人口5,950万人を除くと成人の年間率は約121人に1人となり、これを成人期59年間で累積すると約2.6人に1人に着地する。端的に言えば:現在の率では、米国の成人は人生のどこかで交通事故により負傷する確率が3分の1を上回っており、これに対して自動車事故の死亡確率は約105人に1人である。
この対となる2つの数字は異なる問いに答えるものであり、混ぜてはならない。死亡エントリーは年間10万人あたり12.2人の死亡率から出発する。本エントリーは年間10万成人あたり828人の負傷率を累積しており、負傷の数字は車内の全員に加えてはねられた歩行者と自転車利用者を数える。第三の構成である過失による傷害事故は、誰が負傷事故を引き起こしたかを問い、負傷事故件数を免許保有者数で割ることで同じ近傍——生涯約2.9人に1人——に到達する。この類似は二重計上ではない:各負傷事故につき約1人のドライバーが原因となり、各負傷事故は約1.4人を負傷させるため、引き起こす側の確率と負傷する側の確率は同じ桁に落ち着く。
この数字を動かす要因はおおむねおなじみのものだ。正しく着用されたラップ/ショルダーベルトは乗用車前席乗員の中等度〜重篤な負傷リスクを半減させるため、ベルト非着用は2倍化に相当する(死亡側はシートベルト非着用事故死が扱う)。走行マイルあたりで、16〜19歳のドライバーは20歳以上の3倍の率で死亡事故を起こし、睡眠4時間のドライバーは1回の運転あたり約2.9倍の過失事故オッズを抱える。注意点は両方向に働く:警察報告ベースの集計は誰も届け出なかった負傷を見逃す一方、繰り返しの被害者の存在は、単純な累積計算が示唆するより実際に負傷する人の数が少ないことを意味する。1億マイル走行あたりの負傷率は2022〜2023年に75で横ばいであり、最近の傾向に生涯数値が動きそうな兆候はない。
関連する豆知識
2023年、米国の交通事故は40,901人の命を奪い、推定244万人を負傷させた——死亡1件につき約60件の負傷(NHTSA)。生涯確率:死亡は約105人に1人、負傷は約2.6人に1人。14歳まで車に乗る子どもは約27人に1人。
根拠台帳
以下の各数値は各出典が報告した内容であり、引用した原文の抜粋と算出方法を記載しています。リンクをクリックして直接確認できます。
-
[1] National Highway Traffic Safety Administration (NHTSA) — Summary of Motor Vehicle Traffic Crashes: 2023 Data (DOT HS 813 762)
Summary of Motor Vehicle Traffic Crashes: 2023 Data (DOT HS 813 762)- 統計値
2023: estimated 6,138,359 police-reported traffic crashes; 40,901 killed; estimated 2,442,581 people injured; 1,697,252 injury crashes (Table 1); injury rate 75 per 100 million VMT (unchanged from 2022)- 抜粋
“"In 2023 there were an estimated 6,138,359 police-reported traffic crashes in which 40,901 people were killed and an estimated 2,442,581 people were injured. [...] One person was killed every 13 minutes and an estimated 5 people injured every minute in traffic crashes in 2023. [...] the injury rate per 100 million VMT was 75 in 2022 and remained the same in 2023." ”
- 出典データ
- 2025-10-01
- アクセス日
- 2026-07-26 · アーカイブ版
- 計算過程
- The 2,442,581 persons-injured estimate is the numerator. It counts every injured person — drivers, passengers, pedestrians, and pedalcyclists — in police-reported crashes, estimated from NHTSA's Crash Report Sampling System (CRSS). This is the October 2025 revision of the 2023 file; the earlier release carried 2,442,694, which still appears in the at-fault-injury-crash-liability entry's ledger. Annual rate: 2,442,581 / 334,914,895 ≈ 0.00729.
- 独立性
- CRSS is a probability sample of police crash reports, independent of insurance claims, hospital discharge data, and the FARS fatality census.
-
[2] U.S. Census Bureau — U.S. Population Trends Return to Pre-Pandemic Norms as More States Gain Population (Vintage 2023 estimates)
U.S. Population Trends Return to Pre-Pandemic Norms as More States Gain Population (Vintage 2023 estimates)- 統計値
US resident population 334,914,895 as of July 1, 2023- 抜粋
“"The nation gained more than 1.6 million people this past year, growing by 0.5% to 334,914,895." ”
- 出典データ
- 2023-12-19
- アクセス日
- 2026-07-26 · アーカイブ版
- 計算過程
- Denominator for the annual per-person injury rate. Using the full resident population (all ages) matches the numerator, which also counts injured people of all ages.
- 独立性
- Census Bureau population estimates are produced from birth, death, and migration administrative records, wholly independent of NHTSA crash data.
-
[3] National Highway Traffic Safety Administration (NHTSA) — Traffic Safety Facts 2023 Data: Children (DOT HS 813 712)
Traffic Safety Facts 2023 Data: Children (DOT HS 813 712)See all 2 Likelier entries citing this source →
- 統計値
161,478 children (14 and younger) injured in traffic crashes in 2023; child population 59,498,481. Lap/shoulder belts, correctly used, reduce the risk of moderate-to-critical injury by 50% for front-seat passenger-car occupants 5 and older, and by 65% for light-truck occupants- 抜粋
“"An estimated 161,478 children were injured in traffic crashes in 2023, a 3-percent increase from 156,502 in 2022. [...] There were 59.5 million children in the United States, 18 percent of the total U.S. population. [...] Analysis has also shown that lap/shoulder seat belts, when used correctly, reduce the risk of fatal injury to front-seat occupants 5 and older of passenger cars by 45 percent and the risk of moderate-to-critical injury by 50 percent. For light-truck occupants, seat belts reduce the risk of fatal injury by 60 percent and the risk of moderate-to-critical injury by 65 percent." ”
- 出典データ
- 2025-04-01
- アクセス日
- 2026-07-26 · アーカイブ版
- 計算過程
- Two uses. (1) The 161,478 child-injury count (and the fact sheet's Table 7 child population of 59,498,481) is subtracted from the all-ages numerator and denominator to produce the adult-scoped annual rate in the normalized block. (2) Basis for the unbelted-occupant multiplier: a 50% reduction in moderate-to-critical injury for belted passenger-car occupants implies an unbelted occupant faces roughly 2.0× the injury risk per crash (1 / 0.50), rising toward ~2.9× in light trucks (1 / 0.35). NHTSA's fact sheet attributes the effectiveness estimate to Kahane (2000), DOT HS 809 199.
- 独立性
- Restraint-effectiveness estimates derive from FARS double-pair comparison analyses, a different method and dataset than the CRSS injury-count estimate used for the headline number.
-
[4] Insurance Institute for Highway Safety (IIHS) — Fatality Facts 2022: Teenagers
Fatality Facts 2022: TeenagersSee all 2 Likelier entries citing this source →
- 統計値
Per mile driven, the fatal crash rate for drivers 16-19 is just over 3 times the rate for drivers 20 and older (2022 data)- 抜粋
“"The fatal crash rate per miles driven for 16-19 year-olds is just over 3 times the rate for drivers ages 20 and over." ”
- 出典データ
- 2024-05-01
- アクセス日
- 2026-07-26 · アーカイブ版
- 計算過程
- Basis for the teen-driver multiplier. The 3× figure is a fatal-crash involvement rate per mile driven; police-reported all-severity crash rates for 16-19-year-olds show a similar or larger per-mile elevation, so 3× is used as a conservative injury-risk proxy and labeled with its fatal-crash basis.
- 独立性
- IIHS computes rates from FARS fatality counts and FHWA/NHTSA travel survey mileage, independent of the CRSS injury estimates.
-
[5] Tefft, B.C. — Sleep (Oxford Academic) — Acute sleep deprivation and culpable motor vehicle crash involvement
Acute sleep deprivation and culpable motor vehicle crash involvementSee all 2 Likelier entries citing this source →
- 統計値
Compared with drivers who slept 7-9 hours in the 24 hours before crashing, adjusted odds of culpable crash involvement were 1.3× for 6 hours of sleep, 1.9× for 5 hours, 2.9× (95% CI 1.4-6.2) for 4 hours, and 15.1× (95% CI 4.2-54.4) for less than 4 hours.- 抜粋
“"Drivers who reported having slept for 6, 5, 4, and less than 4 hr in the 24 hr before crashing had 1.3 (95% confidence interval [CI] = 1.04 to 1.7), 1.9 (1.1 to 3.2), 2.9 (1.4 to 6.2), and 15.1 (4.2 to 54.4) times the odds, respectively, of having been culpable for their crashes, compared with drivers who reported 7–9 hr of sleep." ”
- 出典データ
- 2018-09-01
- アクセス日
- 2026-07-26 · アーカイブ版
- 計算過程
- Basis for the sleep-deprivation multiplier (2.9× at 4 hours of sleep, per-trip culpable-crash odds; 5 hours is 1.9×, below 4 hours 15.1×). Case-control analysis drawn from the NHTSA National Motor Vehicle Crash Causation Survey: 6,845 drivers in a representative sample of crashes investigated in 2005-2007.
- 独立性
- Peer-reviewed AAA Foundation analysis of NMVCCS data — a different crash sample than CRSS and FARS.