証拠の質 4.75/5
8次元のレビュー評価。基準は 品質ルーブリック 。各次元は1〜5で評価。
- D1 出典への根拠
- 4/5
- D2 出典の権威性
- 5/5
- D3 算術
- 5/5
- D4 不確実性
- 5/5
- D5 範囲
- 5/5
- D6 文章
- 5/5
- D7 認識の誠実性
- 4/5
- D8 注意事項の完全性
- 5/5

認知リスク
洗濯洗剤ポッドは鮮やかな色で、コンパクトで、柔らかく、これらは子供向けおもちゃの一種にも当てはまる特徴です。幼い子供を持つ親は、ポッドが危険であることを漠然と知っていますが、多くはこれを特定の重症度プロファイルを伴う一刻を争う緊急事態としてではなく、「洗浄剤は施錠して保管する」ことと捉えています。ソーシャルメディアの流行「Tide Pod Challenge」(2018年)に関する報道は、ポッドの毒性への認識を一時的に高めましたが、それは幼児が誤って摂取するのではなく、ティーンエイジャーが故意に食べるという文脈でのものでした。根底にある危険性、すなわち1つのポッドには高濃度のアルカリ性洗剤が含まれており、少量の摂取でも呼吸抑制、食道の化学熱傷、中枢神経系の抑制、昏睡を引き起こす可能性があることは、一般には理解されていません。危険性は方向性としては知られています(親はポッドが危険だと知っています)が、従来の洗剤と比べた重症度プロファイルは大幅に過小評価されています。
概算: ほとんどの親はポッドを手の届かない場所に保管すべきだと認識しているが、その危険性について具体的な数値を持っていない。メンタルモデルのギャップは、軽度の中毒事象と比べた重症度(入院と昏睡のリスク)に関するものである
出典: 編集部の直感(調査に基づかない)
実際のリスク
米国の6歳未満の子供1,000,000人あたり年間約427件の曝露通報(Gaw et al. 2023年、標準策定後の時代)
米国の0〜5歳の子供、毒物管理センター(NPDS)への曝露通報、2022年のデータ
計算を表示
Gaw et al.(2023年、Clinical Toxicology)は、National Poison Data System(NPDS)に基づき、2022年に米国の6歳未満の子供1,000,000人あたり年間427.4件の曝露通報があったと報告しました。これらは、子供が洗剤ポッドに曝露し(摂取、皮膚接触、または眼への曝露)、親や保護者が毒物管理センターに連絡した通報です。単一物質への曝露のうち、6%が重篤な医学的転帰(入院、ICU入院、または呼吸への介入)に至りました。年間の重篤な転帰の発生率は、6歳未満の子供100,000人あたり427.4 × 0.06 = 25.6です。6年間のピークリスク期間(0〜5歳)にわたって累積すると、25.6 × 6 / 100,000 = 0.1536(1,000人あたり)= およそ6,500分の1になります。入院に特化した発生率(2014年のNationwide Children's研究による4.47%の入院率を使用)では、427.4 × 0.0447 × 6 / 1,000,000 ≈ 8,700分の1となります。すべての数値は、ポッドを使用する家庭と使用しない家庭の両方にわたる米国の人口全体の平均です。ポッドを積極的に使用する家庭では、子供あたりの発生率は約4〜5倍高くなります(米国の家庭のポッド普及率が約20〜25%であることを踏まえて)。自主的な安全基準(ASTM F3159-15、2015年施行)は、基準策定前のピークから子供の救急外来受傷率を49〜62%削減しました(Lovegrove et al. 2020年)。現在の発生率は標準策定後の時代を反映しています。2014-2022年のNPDS縦断研究では、記録された小児の死亡は見られません。ポッド摂取による小児の死亡は、以前の症例文献では報告されていますが、極めてまれです。
注意事項: 6,500分の1という数字は、ポッドを使用しない家庭を含む米国の子供人口全体にわたる、0〜5歳のピークリスク期間中の重篤な医学的転帰(入院、ICU、呼吸への介入…
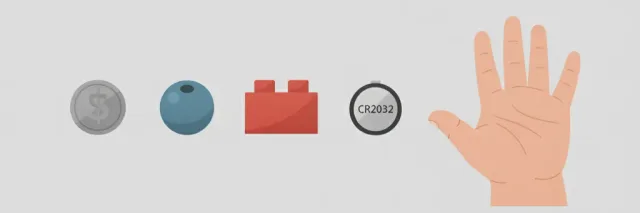
6,500分の1という数字は、ポッドを使用しない家庭を含む米国の子供人口全体にわたる、0〜5歳のピークリスク期間中の重篤な医学的転帰(入院、ICU、呼吸への介入)を表しています。洗剤ポッドを積極的に使用する家庭では、子供あたりの発生率は約4〜5倍高くなります。NPDSサーベイランスにおける「重篤な医学的転帰」には、ICUでの経過観察から昏睡や挿管までの幅が含まれ、致命的な転帰を必要とはしません。2014-2022年の縦断的サーベイランスにおける9件の死亡はすべて70歳超の成人であり、そのデータセットには小児の死亡は見られませんが、自主的安全基準の時代以前の初期の症例報告には小児の死亡が含まれています。2022年の発生率(1,000,000人あたり427.4)は基準策定前のピークよりも大幅に低いものの、依然として高い水準にあります。自主的なASTM基準(2015年)は救急外来受傷率の49〜62%の削減と関連していましたが、ポッドの摂取は全国で約44分ごとに1件の割合で続いています。このエントリーはすべての曝露経路(摂取、眼への曝露、皮膚接触)を対象としていますが、摂取が最も重症度が高くなります。眼への曝露は洗浄を必要とする化学熱傷を引き起こしますが、全身性の影響はまれです。ボタン電池の誤飲との比較では、ポッドはより多くの曝露を引き起こしますが、曝露あたりの重篤な転帰は少なくなります。ボタン電池ははるかに少ない曝露しか引き起こしませんが、20mm以上のリチウム電池の部分集合では壊滅的な転帰率を示します。
関連するリスク
似たテーマの他のリスク — 関連する不安を探るために。







比較対象を選択
Laundry detergent pods contain concentrated alkaline cleaning agents in a formulation with substantially less water than traditional liquid detergent, packaged in a thin water-soluble membrane that dissolves on contact with a wet surface — including the inside of a toddler’s mouth. When a child bites or squeezes a pod, the membrane ruptures and deposits the full concentrated dose of surfactant, builder, and enzyme directly onto mucosal tissue. The result is not an ordinary detergent exposure: Davis and colleagues (2016, Pediatrics) found that laundry pod exposures were associated with 4.8 to 23.5 times higher odds of hospitalization and 6.9 to 71.3 times higher odds of intubation than traditional detergent exposures in children. Both deaths in their 2013-2014 dataset were pod-associated; neither was from traditional detergent.
Gaw et al. (2023, Clinical Toxicology), analysing 114,826 exposure calls to US Poison Control Centers from 2014 to 2022, found that children under 6 account for 87% of all laundry pod exposures and the current annual exposure rate is 427 calls per million US children under 6. Six percent of single-substance exposures result in serious medical outcomes. Compounded across the six-year peak-risk window (ages 0-5), roughly 1 in 6,500 US children experience a serious medical outcome from a laundry pod exposure. In households that use pods, the rate is approximately four to five times higher. No confirmed pediatric deaths appear in the 2014-2022 surveillance dataset, though pediatric fatalities were reported in earlier case literature before the voluntary safety standard era.
The ASTM F3159-15 voluntary standard, published in October 2015, required compression resistance of at least 300 Newtons, a bitter aversive agent in the soluble film, and child-resistant outer packaging. Lovegrove et al. (2020, American Journal of Public Health) found the standard was associated with a 49-62% reduction in child ED injury rates, estimating it prevented 9,200 to 23,000 ED-treated injuries over 2015-2018. The current exposure rate (one Poison Control call every 44 minutes nationally) represents the floor of the voluntary-standard era. Mandatory PPPA-compliant child-resistant packaging, which some researchers and paediatricians have called for, has not been implemented; the persistence of exposures at this rate reflects the limits of voluntary measures and the ongoing challenge that the pods’ physical properties — compact, brightly coloured, soft, slightly translucent — remain similar to attractive objects in a toddler’s environment.
関連する豆知識
米国の0〜5歳の子どもの約6,500人に1人が、洗濯用洗剤ポッドへの曝露で重篤な医学的転帰を経験します。親はポッドを手の届かない場所に置くことは知っていますが、重症度を過小評価しています。濃縮ポッドは単なる軽い胃の不調ではなく、気道の熱傷や昏睡を引き起こすことがあります。
根拠台帳
以下の各数値は各出典が報告した内容であり、引用した原文の抜粋と算出方法を記載しています。リンクをクリックして直接確認できます。
1/5 件の出典が引用元と一字一句一致することを独立して検証済み
-
[1] Clinical Toxicology — Gaw, Center for Injury Research and Policy, Nationwide Children's Hospital, 2023 — Longitudinal trends in liquid laundry detergent packet exposures: 2014–2022 検証済み
Longitudinal trends in liquid laundry detergent packet exposures: 2014–2022- 統計値
114,826 total NPDS exposure calls (2014-2022); children under 6 account for 87% of calls; 2022 rate 427.4 per million children under 6; 6% serious medical outcomes; 9 deaths (all adults over 70); one call every 44 minutes in most recent 3-year period- 抜粋
“"Many families don't realize how toxic these highly concentrated laundry detergent packets can be... 114,826 total NPDS exposure calls, January 2014-December 2022... children under 6 [accounted for] 87% of all exposures... Annual rate (2022): 427.4 exposures per 1 million children under 6... 6% of single-substance exposures resulted in serious medical outcomes... 9 deaths over the 9-year period — all adults; 7 were over age 70; no child deaths." ”
- 出典データ
- 2023-12-15
- アクセス日
- 2026-05-09 · アーカイブ版
- 検証
- グラウンディング監査の際、抜粋を引用元から独立して再取得し、原文と一字一句一致することを確認しました。
- 計算過程
- 427.4/million/year is the primary exposure rate used for native numerator. The 6% serious-outcome rate is applied to this to compute normalized lifetime figure: 427.4 × 0.06 × 6 years / 1,000,000 = 0.0001537 ≈ 1 in 6,500. The 9 deaths in 2014-2022 were all adults; no confirmed pediatric deaths in this systematic surveillance period, although earlier case reports document pediatric deaths before the voluntary safety standard era.
-
[2] American Journal of Public Health — Lovegrove et al., 2020 — Impact of the Voluntary Safety Standard for Liquid Laundry Packets on Child Injuries Treated in US Hospital Emergency Departments, 2012–2018
Impact of the Voluntary Safety Standard for Liquid Laundry Packets on Child Injuries Treated in US Hospital Emergency Departments, 2012–2018- 統計値
ASTM F3159-15 voluntary standard associated with 49-62% reduction in child ED injury rate; prevented 9,200-23,000 ED-treated injuries (2015-2018); ED visit rate fell from peak ~5,700/year to ~3,340/year by 2018- 抜粋
“"The voluntary standard may have reduced the child injury rate by 49.4% to 61.6% from levels that would have been expected in the absence of the voluntary standard... [and] may have prevented 9,200 to 23,000 ED-treated injuries from 2015 to 2018." ”
- 出典データ
- 2020-07-01
- アクセス日
- 2026-05-09 · アーカイブ版
- 計算過程
- The pre-standard peak of ~5,700 child ED visits/year and post-standard ~3,340/year (2018) reflect the effect of ASTM F3159-15 (compression resistance ≥300 N, bitter aversive agent, child-resistant outer packaging). The current rate in Gaw 2023 (2022 data) has continued to decline modestly from the 2018 level. Lovegrove provides the trajectory context showing that the current hazard profile is substantially improved from the pre-standard peak but has not reached zero.
- 独立性
- Lovegrove et al. use NEISS-based ED visit data from the CDC WISQARS system, which is methodologically independent of Gaw et al.'s NPDS call-based surveillance. The two approaches measure different endpoints (ED visits vs. poison control calls) and confirm each other's order of magnitude.
-
[3] CDC Morbidity and Mortality Weekly Report, October 12, 2012 — Health Hazards Associated with Laundry Detergent Pods — United States, May–June 2012
Health Hazards Associated with Laundry Detergent Pods — United States, May–June 2012- 統計値
80% of children under 5 exposed to pods had minor, moderate, or major adverse effects; significantly higher vomiting (55% vs 34%), drowsiness/lethargy (7% vs 2%) than non-pod detergent exposure- 抜粋
“"Among children aged ≤5 years, a significantly greater proportion of those exposed to laundry detergent from pods had gastrointestinal and respiratory adverse health effects and mental status changes... 80% of pod-exposed children under 5 had adverse effects vs 63% for non-pod exposures." ”
- 出典データ
- 2012-10-12
- アクセス日
- 2026-05-09 · アーカイブ版
- 計算過程
- This is the earliest CDC surveillance report on pod-specific toxicity in children, establishing the pre-standard baseline for severity comparison. The 80% adverse-effect rate vs. 63% for non-pod detergents, and the notably higher drowsiness/lethargy (7% vs. 2%), documented the CNS-depression component of pod toxicity that distinguishes it from ordinary detergent exposure. Used here for severity context rather than for current rate estimation.
-
[4] Pediatrics — Davis, Casavant, Spiller, Chounthirath & Smith, 2016 — Pediatric Exposures to Laundry and Dishwasher Detergents in the United States: 2013-2014
Pediatric Exposures to Laundry and Dishwasher Detergents in the United States: 2013-2014- 統計値
Laundry pod exposures vs. traditional detergent: OR 3.9-8.2 for clinical effects; OR 4.8-23.5 for hospitalisation; OR 6.9-71.3 for intubation; OR 8.4-22.6 for serious medical outcome; 2 deaths associated with pods vs. zero with traditional detergent (2013-2014)- 抜粋
“"The odds of clinical effects (3.9-8.2), hospitalisation (4.8-23.5), intubation (6.9-71.3), and serious medical outcomes (8.4-22.6) were significantly higher for laundry detergent packet exposures than for other types of detergent." ”
- 出典データ
- 2016-06-20
- アクセス日
- 2026-05-09 · アーカイブ版
- 計算過程
- Davis et al. is the head-to-head comparison that quantifies how much more dangerous pods are than traditional detergent — the source for the "5-8x more dangerous" claims in public health communications. The intubation OR upper bound of 71.3 is the most striking single figure: it means that in the most severe scenarios, pod exposure was associated with intubation at a rate up to 71 times higher than traditional detergent exposure. This source anchors the severity framing rather than the rate calculation.
- 独立性
- Davis et al. draw from the 2013-2014 NPDS data among children under 6 using a comparison of pod vs. non-pod detergent outcomes. Methodologically distinct from the longitudinal trend analyses of Gaw 2023 and the ED-visit-based approach of Lovegrove 2020.
-
[5] Nationwide Children's Hospital, Center for Injury Research and Policy — New Study Finds Liquid Laundry Detergent Packet Exposure Burden among Young Children Remains; Increase in Exposures among Older Children, Teens, and Adults
New Study Finds Liquid Laundry Detergent Packet Exposure Burden among Young Children Remains; Increase in Exposures among Older Children, Teens, and Adults- 統計値
Researchers recommend that all liquid laundry detergent packet packaging be made PPPA-compliant and that each packet be individually wrapped in child-resistant packaging, beyond the current voluntary ASTM standard- 抜粋
“"Requiring that all liquid laundry detergent packet packaging be PPPA-compliant would be an important next step in reducing child access to these products." "Each laundry packet should be individually wrapped with child-resistant packaging, which would provide important layers of protection for this highly toxic product." ”
- 出典データ
- 2024-01-22
- アクセス日
- 2026-07-03 · アーカイブ版
- 計算過程
- Institutional press release accompanying the Gaw et al. (2023) Clinical Toxicology study (source above), issued by the same research group (Nationwide Children's Hospital Center for Injury Research and Policy). Cited only to substantiate the body text's closing claim that mandatory Poison Prevention Packaging Act (PPPA)-compliant, individually wrapped child-resistant packaging — beyond the current voluntary ASTM standard — is a specific recommendation researchers have made; not used for the headline exposure-rate arithmetic, which rests on the peer-reviewed Gaw et al. statistic above.
- 独立性
- Same research group and underlying dataset as the Gaw et al. (2023) peer-reviewed source above; included separately because the policy-recommendation language (PPPA compliance) appears in the institutional press release rather than the journal excerpt already quoted.