Evidenzqualität 4.88/5
Bewertungsergebnis nach acht Dimensionen gemäß der Qualitätsrubrik . Jede Dimension wird mit 1–5 bewertet.
- D1 Quellenverankerung
- 5/5
- D2 Quellenautorität
- 5/5
- D3 Arithmetik
- 5/5
- D4 Unsicherheit
- 5/5
- D5 Geltungsbereich
- 5/5
- D6 Prosa
- 5/5
- D7 Ehrlichkeit zur Wahrnehmung
- 4/5
- D8 Vollständigkeit der Einschränkungen
- 5/5
● Ihre Faktoren — auf dieses Risiko ▾ klicken zum Anzeigen
- Deine Faktoren
≈ Genauso wahrscheinlich wie

Wahrgenommen
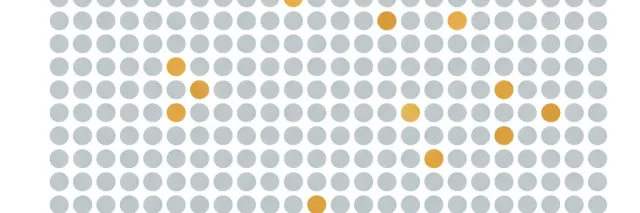
Rückenschmerzen nehmen eine seltsame Stellung in der Angstlandschaft ein: Fast niemand nennt sie in einer Angst-Umfrage, dabei sind sie die mit Abstand größte Ursache für Behinderung auf dem Planeten. Junge Erwachsene behandeln sie als eine Unannehmlichkeit des mittleren Alters, etwas, das Schreibtischarbeitern und Wochenend-Sportlern passiert, die falsch heben. Das mentale Modell ist akut und selbstlimitierend: Der Rücken macht schlapp, man ruht sich aus, es wird besser. Dieses Modell stimmt für viele Episoden und liegt beim kumulativen Lebenszeitbild gründlich daneben. Bittet man einen 25-Jährigen, die Wahrscheinlichkeit zu schätzen, dass er irgendwann im Leben erhebliche Kreuzschmerzen erleben wird, erhält man Schätzungen im Bereich von 20-30 %. Die tatsächliche Zahl liegt näher bei 80 %. Die chronische Form (drei Monate oder länger andauernd) wird ebenfalls unterschätzt: Ungefähr einer von fünf Erwachsenen hat zu jedem gegebenen Zeitpunkt damit zu tun, eine Prävalenz, die die meisten der dramatischen Gesundheitsängste in den Schatten stellt, die die Schlagzeilen beherrschen.
Grobe Schätzung: Die meisten Erwachsenen unter 40 nehmen an, ihr Lebenszeitrisiko für Rückenschmerzen liege bei etwa 1 von 4
Quelle: redaktionelle Einschätzung, nicht erhoben
Tatsächlich
~619 Millionen Menschen mit Kreuzschmerzen weltweit (2020); ~39 % der US-Erwachsenen berichten Rückenschmerzen in einem 3-Monats-Fenster
US-Erwachsene
Berechnung anzeigen
Verwendet die Leitaussage des NINDS-Merkblatts, dass etwa 80 % der Erwachsenen irgendwann in ihrem Leben Kreuzschmerzen erleben, gegengeprüft anhand der systematischen GBD-2021-Analyse (Lancet Rheumatology, 2023), die für 2020 weltweit 619 Millionen prävalente Fälle bei ~5,2 Milliarden Erwachsenen (Alter 20+) schätzte, was einer Punktprävalenz von ~12 % entspricht. Bei einer Einjahresprävalenz von ~38 % (im Einklang mit CDC/NCHS Data Brief 415, der 39,0 % der US-Erwachsenen mit Rückenschmerzen in einem 3-Monats-Fenster berichtet) und Studien, die Rückfallraten von 24-80 % innerhalb eines Jahres zeigen, konvergiert die kumulative Lebenszeitinzidenz mindestens einer erheblichen Episode in Bevölkerungen hoher Einkommen gegen 80 %. Für chronische Kreuzschmerzen im engeren Sinne (3+ Monate andauernd) berichtete eine systematische Übersicht (Meucci et al., 2015) eine Punktprävalenz von 4,2 % im Alter von 24-39 und 19,6 % im Alter von 20-59 (die vielzitierte Zusammenfassungszahl von 20,1 %, die sie diskutiert, stammt von Hoy et al. 2012). Die Leitzahl verwendet die breitere Lebenszeitprävalenz für »jede erhebliche Rückenschmerzepisode«, weil die Frage nach der Entwicklung chronischer Rückenschmerzen fragt und die meisten chronischen Fälle als akute Episoden beginnen, die nicht ausheilen. Die Unsicherheitsspanne 0,70-0,85 spiegelt die methodische Variation zwischen Studien wider, die unterschiedliche Definitionen von »erheblichem« Schmerz und unterschiedliche Erinnerungsfenster verwenden.
Einschränkungen: Die Leitzahl von 80 % über die Lebenszeit bezieht sich auf jede erhebliche Kreuz…
Die Leitzahl von 80 % über die Lebenszeit bezieht sich auf jede erhebliche Kreuzschmerzepisode, nicht speziell auf chronische Schmerzen. Chronische Kreuzschmerzen (herkömmlich definiert als 3 Monate oder länger andauernd) haben eine Punktprävalenz von rund 20 % und eine kumulative Lebenszeitinzidenz, die schwerer zu bestimmen ist, weil die Definitionen zwischen Studien variieren und viele Episoden wiederkehrend statt durchgehend vorhanden sind. Die Unterscheidung zwischen »akuten Rückenschmerzen, die abklingen« und »chronischen Rückenschmerzen« ist klinisch wichtig, aber epidemiologisch unscharf: Die meisten chronischen Fälle beginnen als akute Episoden, und ein erheblicher Anteil »abgeklungener« akuter Episoden kehrt innerhalb eines Jahres wieder. Die GBD-Zahl von 619 Millionen ist eine Punktprävalenz-Zählung (Menschen mit Kreuzschmerzen an einem gegebenen Tag), keine Lebenszeitzählung. Die NINDS-Zahl von 80 % ist eine Schätzung der kumulativen Lebenszeitinzidenz, synthetisiert aus mehreren epidemiologischen Erhebungen. Die personal_factor_multipliers für Beruf, BMI und Rauchen spiegeln die drei modifizierbaren Risikofaktoren wider, die in der GBD-2021-Analyse identifiziert wurden; der Multiplikator für Depression/Angst spiegelt eine bidirektionale Beziehung wider, bei der die kausale Richtung wirklich ungewiss ist. Alle Multiplikatoren sind ungefähre relative Risiken aus heterogener Beobachtungsliteratur und nicht additiv.
Verwandte Risiken
Andere Risiken zu ähnlichen Themen — zum Erkunden verwandter Ängste.

Abenteuersportarten
Wie hoch ist die Wahrscheinlichkeit einer schwerwiegenden Verletzung bei regelmäßiger Teilnahme an Surfen, Mountainbiking oder Klettern?

Alkoholkonsumstörung
Wie hoch ist die Wahrscheinlichkeit, im Laufe des Lebens eine Alkoholkonsumstörung zu entwickeln?

Resistente Infektion
Wie hoch ist das Risiko, eine schwere antibiotikaresistente Infektion zu entwickeln?

Angststörung
Wie hoch ist die Wahrscheinlichkeit, im Laufe des Lebens eine Angststörung zu entwickeln?

Kein Knochenmark-Match
Wie hoch ist die Wahrscheinlichkeit, keinen passenden Knochenmarkspender zu finden?

Vererbtes AUD-Risiko
Wenn ein Elternteil eine Alkoholkonsumstörung hatte, wie hoch ist die Wahrscheinlichkeit, dass Sie selbst eine Alkoholkonsumstörung entwickeln?
Falsch-positive Mammografie
Wie hoch ist die Wahrscheinlichkeit eines falsch-positiven Ergebnisses bei einer Mammografie?

Fliegen mit Erkältung
Wie hoch ist die Wahrscheinlichkeit für ein Ohrbarotrauma oder ein geplatztes Trommelfell beim Fliegen mit einer Erkältung?
Vergleichsrisiko wählen
About 80% of adults experience significant low back pain at some point in their lives according to the National Institute of Neurological Disorders and Stroke, making it one of the highest-probability health outcomes on the entire Likelier site. The Global Burden of Disease Study 2021 estimated 619 million people had low back pain globally in 2020, with the condition ranking as the number-one cause of years lived with disability worldwide — ahead of depression, diabetes, hearing loss, and every other condition GBD tracks. In the US, CDC data shows 39% of adults report back pain in any given three-month window. For chronic low back pain specifically (lasting three months or longer), a systematic review reported a point prevalence climbing with age — about 4% among younger adults and roughly 20% across the 20-59 band — at any point in time. That figure is projected to worsen: the GBD analysis forecasts 843 million prevalent cases by 2050, a 36% increase from 2020, driven primarily by population growth and, in Asia and Latin America, an ageing population.
The perception gap here is not that people think back pain is rare — most adults know someone who has dealt with it. The gap is that it is almost never framed as a probability question, and when it is, the numbers are startling in context. An 80% lifetime prevalence puts back pain in the same league as “ever having a cavity” and far above every dramatic health fear on this site. It is roughly 2.5 times more likely than developing type 2 diabetes over a lifetime, about 9 times more likely than dying of heart disease, and roughly 74 times more likely than dying in a car crash. Yet it does not appear in fear surveys, does not feature in disaster coverage, and is not what people picture when they think about health risks. The Lancet’s 2018 Low Back Pain Series called attention to this mismatch directly, noting that the global response to back pain has been inadequate relative to its disability burden, with too much care of low value (imaging, opioids, surgery) and too little investment in the prevention and self- management strategies that the evidence actually supports.
Where the number shifts: the GBD 2021 analysis identified three modifiable risk factors that together explain 39% of back-pain disability — occupational ergonomic factors (lifting, awkward postures, prolonged sitting), high BMI, and smoking. Age is the strongest non-modifiable factor; chronic low back pain prevalence climbs roughly linearly from the third decade of life through age 60. Depression and anxiety have a well-documented bidirectional relationship with chronic back pain — psychological distress is one of the strongest predictors of the transition from an acute episode to a chronic one, per the Lancet 2018 series, and chronic pain in turn elevates depression risk. A physically active, non-smoking 25-year-old with normal BMI runs meaningfully lower odds than the headline number; a sedentary, overweight 55-year-old with comorbid depression runs meaningfully higher. The gap between these subgroups is roughly twentyfold based on the entry’s own risk-factor multipliers, which is wide enough to make the population average misleading for either end of the distribution.
Verwandte Fakten
Chronische Rueckenschmerzen betreffen 80% der Erwachsenen. Krebs betrifft ~40%. Rueckenschmerzen sind die Nr. 1 Ursache fuer Behinderung weltweit, aber niemand veranstaltet Spendengalas fuer Bandscheibenerkrankungen.
Etwa 80% der Erwachsenen werden im Leben erhebliche Rueckenschmerzen haben. Toedliche Haiangriffe betreffen ~1 von 4.300.000. Eines macht Schlagzeilen; das andere laesst Menschen bei der Arbeit fehlen.
Chronische Rueckenschmerzen betreffen 80% der Erwachsenen im Leben. Scheidung trifft ~42%. Deine Wirbelsaeule ist ein unzuverlaessigerer Partner als dein Ehepartner.
Quellenregister
Jede Zahl unten ist das, was die jeweilige Quelle berichtet hat — mit dem wörtlichen Zitat, auf das wir uns stützen, und wie wir zu unserer Zahl gelangt sind. Klicke auf einen Link, um direkt zu prüfen.
3/5 Quellen unabhängig wortwörtlich mit der zitierten Quelle abgeglichen
-
[1] The Lancet Rheumatology — Global, regional, and national burden of low back pain, 1990-2020, its attributable risk factors, and projections to 2050: a systematic analysis of the Global Burden of Disease Study 2021
Global, regional, and national burden of low back pain, 1990-2020, its attributable risk factors, and projections to 2050: a systematic analysis of the Global Burden of Disease Study 2021- Statistik
619 million (95% UI: 554-694 million) people had low back pain globally in 2020; low back pain is the leading cause of years lived with disability worldwide; projected to reach 843 million by 2050- Auszug
“"In 2020, low back pain affected 619 million (95% uncertainty interval 554 to 694) people globally [...] low back pain remains the leading cause of years lived with disability [...] Cases of low back pain are projected to increase to 843 million (759 to 933) by 2050 [...] Occupational ergonomic factors, smoking, and high BMI explained 38.8% (28.7 to 47.0) of years lived with disability due to low back pain." ”
- Quelldaten von
- 2023-06-05
- Abgerufen
- 2026-04-19 · archivierte Kopie
- Berechnung
- 619 million prevalent cases / ~5.2 billion adults globally (age 20+) = ~12% global point prevalence. This is the snapshot count at any given moment. Given that most back pain episodes last weeks to months and recurrence is high, the cumulative lifetime incidence is far higher than the point prevalence. The GBD finding that low back pain is the #1 cause of YLDs worldwide (ahead of depressive disorders, diabetes, hearing loss, and all other conditions) anchors the claim that this is the leading cause of disability globally. The paper's decomposition analysis of the 619-million-to-843-million 2020-2050 projection found population growth is the largest contributor in most regions, except in east Asia, south Asia, and tropical/southern Latin America and the Caribbean, where population ageing is the dominant driver instead -- grounding the body text's claim about regional projection drivers.
- Unabhängigkeit
- GBD/IHME is the upstream methodology; partially overlaps with WHO disability estimates but uses independent systematic review of prevalence studies.
-
[2] National Institute of Neurological Disorders and Stroke (NINDS) — Low Back Pain Fact Sheet Verifiziert
Low Back Pain Fact Sheet- Statistik
About 80 percent of adults experience low back pain at some point in their lifetimes; it is the most common cause of job-related disability- Auszug
“"About 80 percent of adults experience low back pain at some point in their lifetimes. It is the most common cause of job-related disability and a leading contributor to missed work days. [...] Most low back pain is acute, or short term, and lasts a few days to a few weeks. It tends to resolve on its own with self-care and there is no residual loss of function." ”
- Quelldaten von
- 2023-11-28
- Abgerufen
- 2026-04-19 · archivierte Kopie
- Verifizierung
- Der Auszug wurde bei unserer Grounding-Prüfung unabhängig erneut abgerufen und Wort für Wort mit der zitierten Quelle abgeglichen.
- Berechnung
- The 80% lifetime prevalence figure is the primary anchor for the normalized headline number. NINDS derives this from a synthesis of epidemiological literature including NHANES and NHIS data. The fact sheet also notes that most acute episodes resolve, which is important context: the 80% figure is cumulative incidence of any significant episode, not 80% chronic prevalence. Used as the authoritative US government source for the lifetime headline.
- Unabhängigkeit
- NINDS synthesizes from US epidemiological surveys (NHIS, NHANES) and clinical literature; methodologically independent from GBD.
-
[3] US Centers for Disease Control and Prevention / NCHS — Back, Lower Limb, and Upper Limb Pain Among U.S. Adults, 2019
Back, Lower Limb, and Upper Limb Pain Among U.S. Adults, 2019- Statistik
39.0% of US adults experienced back pain in the past 3 months (2019 NHIS); prevalence increased with age and was highest among adults 65+- Auszug
“"Among adults, 39.0% experienced back pain, 36.5% experienced lower limb pain, and 30.7% experienced upper limb pain. [...] The percentage of adults who experienced back pain increased with age. [...] Women, non-Hispanic white adults, and those with income below 100% FPL were most likely to experience back pain." ”
- Quelldaten von
- 2021-07-30
- Abgerufen
- 2026-04-19 · archivierte Kopie
- Berechnung
- 39% of US adults reporting back pain in a 3-month recall window (2019 NHIS) implies a rough annual prevalence of ~50-55% after adjusting for episode duration and seasonal overlap. Compounding across a 60-year adult life with even modest recurrence yields a lifetime cumulative incidence consistent with the NINDS 80% figure. This source anchors the "current burden" framing and provides the demographic breakdown.
- Unabhängigkeit
- CDC/NCHS uses NHIS survey data, which is the same upstream as the NINDS synthesis but applies different statistical methods and recall windows.
-
[4] Revista de Saude Publica (PMC) — Prevalence of chronic low back pain: systematic review Verifiziert
Prevalence of chronic low back pain: systematic review- Statistik
Chronic low back pain prevalence was 4.2% at ages 24-39 and 19.6% at ages 20-59; prevalence increases linearly from the third decade to age 60 and is more prevalent in women (the often-quoted 20.1% summary figure is from Hoy et al. 2012, which this review cites)- Auszug
“"Chronic low back pain prevalence was 4.2% in individuals aged between 24 and 39 years old and 19.6% in those aged between 20 and 59. [...] Chronic low back pain prevalence increases linearly from the third decade of life on, until the 60 years of age, being more prevalent in women. [...] Hoy et al made a valuable contribution to low back pain studies and estimated a summary prevalence of CLBP of 20.1% (SD = 9.8)." ”
- Quelldaten von
- 2015-10-20
- Abgerufen
- 2026-04-19 · archivierte Kopie
- Verifizierung
- Der Auszug wurde bei unserer Grounding-Prüfung unabhängig erneut abgerufen und Wort für Wort mit der zitierten Quelle abgeglichen.
- Berechnung
- This review reports chronic low back pain (defined as lasting 3+ months) at 4.2% among adults aged 24-39 and 19.6% among adults aged 20-59, and concludes that prevalence rises roughly linearly from the third decade to age 60, being higher in women. The frequently quoted 20.1% (SD = 9.8) summary prevalence is NOT this review's own pooled estimate — it is attributed here to Hoy et al. (2012). The narrower "chronic" definition (point prevalence on the order of 10-20% depending on age) sits below the broader "any back pain episode" lifetime figure of ~80%. Used to validate the chronic-specific prevalence claim and to anchor the personal_factor_multipliers age gradient.
- Unabhängigkeit
- Independent systematic review of 28 studies from multiple countries; does not share upstream data with GBD or CDC/NHIS estimates.
-
[5] The Lancet (Buchbinder R, van Tulder M, Oberg B, et al.) — third paper in the 2018 Lancet Low Back Pain Series — Low back pain: a call for action Verifiziert
Low back pain: a call for action- Statistik
Low back pain is the leading worldwide cause of years lost to disability; the 2018 Lancet series (three companion papers) documented substantial global overuse of low-value care (imaging, opioids, spinal surgery) alongside underuse of recommended prevention and self-management approaches- Auszug
“"Low back pain is the leading worldwide cause of years lost to disability and its burden is growing alongside the increasing and ageing population. [...] our Viewpoint, the third paper in this Lancet Series, is a call for action on this global problem of low back pain." ”
- Quelldaten von
- 2018-03-21
- Abgerufen
- 2026-07-03 · archivierte Kopie
- Verifizierung
- Der Auszug wurde bei unserer Grounding-Prüfung unabhängig erneut abgerufen und Wort für Wort mit der zitierten Quelle abgeglichen.
- Berechnung
- Grounds the body text's two references to "the Lancet 2018 series" and the personal_factor_multipliers note on the depression/anxiety comorbidity factor. This call-for-action viewpoint is the third of three companion papers (Hartvigsen et al., Lancet 2018;391:2356-67; Foster et al., Lancet 2018;391:2368-83; Buchbinder et al., Lancet 2018;391:2384-88) that collectively documented global overuse of low-value care (imaging, opioids, spinal surgery) and underuse of recommended prevention/self-management approaches -- the evidence-practice mismatch referenced in the body prose. A 2020 update to the series (PMC7434211) confirms the original findings, e.g. a 2012 US VA study found 59% of outpatient lumbar-spine scans were inappropriate, and $12.8 billion was spent on spinal fusion surgery in 2011 despite a 20% failure rate and little supporting evidence.
- Unabhängigkeit
- Independent health-policy/editorial synthesis layered on the same epidemiological evidence base as the GBD and NINDS sources above; added specifically to ground the body's references to "the Lancet 2018 series," which this entry discussed without a citation.