Evidenzqualität 4.63/5
Bewertungsergebnis nach acht Dimensionen gemäß der Qualitätsrubrik . Jede Dimension wird mit 1–5 bewertet.
- D1 Quellenverankerung
- 5/5
- D2 Quellenautorität
- 5/5
- D3 Arithmetik
- 4/5
- D4 Unsicherheit
- 4/5
- D5 Geltungsbereich
- 5/5
- D6 Prosa
- 5/5
- D7 Ehrlichkeit zur Wahrnehmung
- 4/5
- D8 Vollständigkeit der Einschränkungen
- 5/5
● Ihre Faktoren — auf dieses Risiko ▾ klicken zum Anzeigen
- Deine Faktoren
≈ Genauso wahrscheinlich wie

Wahrgenommen
Die Zwangsvollstreckungskrise von 2008 hinterließ einen tiefen Abdruck in der amerikanischen Psyche. Nachrichtenbilder von vernagelten Wohnsiedlungen, überschuldeten Kreditnehmern und bankeigenen Schildern wurden für eine ganze Generation zum dominanten Bild des Wohneigentumsrisikos. Die meisten Erwachsenen, die sie durchlebt haben, überschätzen die aktuelle Wahrscheinlichkeit einer Zwangsvollstreckung, verankert an Bildern der Krisenzeit statt am Kreditvergabeumfeld nach Dodd-Frank. Umfragen zu finanzieller Angst platzieren »den Verlust meines Zuhauses« durchweg nahe an der Spitze, oft über Risiken, die statistisch weit wahrscheinlicher sind, wie Arbeitsplatzverlust oder medizinisch bedingte Insolvenz.
Grobe Schätzung: ~10-20 % Lebenszeitschätzung für ängstliche Hausbesitzer
Quelle: redaktionelle Einschätzung, nicht erhoben
Tatsächlich
~367.460 Zwangsvollstreckungseinreichungen im Jahr 2025 (0,26 % der US-Wohneinheiten)
US-Wohneinheiten
Berechnung anzeigen
ATTOM Data meldete 367.460 Immobilien mit Zwangsvollstreckungseinreichungen im Jahr 2025, was 0,26 % von etwa 142 Millionen US-Wohneinheiten entspricht. Abgeschlossene Zwangsvollstreckungen (Bankrücknahmen / REO) beliefen sich jedoch auf nur 46.439 oder etwa 0,09 % der mit Hypotheken belasteten Immobilien. Die jährliche Einreichungsrate von 0,26 % ist eine Normalisierungszahl nach der Pandemie, weit unter der Rate von 2019 vor der Pandemie (~0,36 %) und weit unter dem Höchststand von 2010 (~2,23 %). Eine longitudinale Kohortenstudie der BLS (NLSY79, die zwischen 1957 und 1964 geborene Babyboomer von 1988 bis 2008 verfolgt) fand, dass etwa 2 % eine Zwangsvollstreckungsmitteilung erhielten und rund 1,4 % über einen Zeitraum von 20 Jahren ein Zuhause durch Zwangsvollstreckung verloren — aber diese Kohorte umfasste zufällig die schlimmste Immobilienkrise der modernen Geschichte. Für eine Lebenszeitschätzung, die 30-35 Jahre potenzieller Hypothekenexposition umfasst (Alter 25-60, wobei die meisten Hausbesitzer über den Zeitraum 1-3 Hypotheken halten), ergibt die Verbindung der langfristigen durchschnittlichen jährlichen Einreichungsrate von rund 0,2-0,3 % über normale Jahre, aber einschließlich eines schweren Zyklus, etwa 5-10 %. Der zentrale Schätzwert von 7 % spiegelt die Realität wider, dass die meisten Hausbesitzer mindestens eine schwere Rezession durchleben werden, dass aber die regulatorischen Reformen nach 2008 (Qualified-Mortgage-Regeln, Dodd-Frank, strengere Kreditprüfung) das Extremrisiko gegenüber der Ära vor der Krise strukturell reduziert haben. Die St. Louis Fed schätzte, dass zwischen 2006 und 2014 fast 10 Millionen Hausbesitzer ihre Häuser verloren, von damals rund 50-55 Millionen mit Hypotheken belasteten Häusern — eine kumulative Rate der Krisenzeit von rund 18-20 %, die nicht als Basislinie behandelt werden sollte.
Einschränkungen: Der zentrale Schätzwert von 7 % ist eine konstruierte Lebenszeitwahrscheinlichke…
Der zentrale Schätzwert von 7 % ist eine konstruierte Lebenszeitwahrscheinlichkeit, keine direkt beobachtete Bevölkerungsstatistik. Keine einzelne Datenquelle verfolgt einzelne Hausbesitzer von der ersten bis zur letzten Hypothek. Die BLS-NLSY79-Kohortenstudie ist die nächste Annäherung, deckt aber nur 20 Jahre (1988-2008) und eine einzige Geburtskohorte ab. Die Schätzung nimmt an, dass die meisten Hausbesitzer 25-35 Jahre lang Hypotheken halten und während dieses Zeitraums mindestens eine schwere Rezession erleben werden. Regulatorische Reformen nach 2008 (Qualified-Mortgage-Regeln, Dodd-Frank-Anforderungen zur Rückzahlungsfähigkeit, höhere Kapitalanforderungen für Banken) könnten das Zwangsvollstreckungsrisiko für Kreditnehmer, die unter dem neuen Regime geprüft wurden, strukturell reduziert haben, was die tatsächliche Lebenszeitwahrscheinlichkeit für jüngere Hausbesitzer unter den zentralen Schätzwert von 7 % drücken würde. Das Verhältnis von Einreichung zu Abschluss beträgt etwa 8:1, was bedeutet, dass die meisten Zwangsvollstreckungseinreichungen gelöst werden, bevor das Zuhause tatsächlich verloren geht; die Schlagzeilenzahlen zu »Zwangsvollstreckungseinreichungen« überzeichnen den tatsächlichen Wohnungsverlust erheblich. Die geografische Variation ist extrem: Spekulative Märkte im Sun Belt (Nevada, Florida, Arizona) erlebten während der Krise das 3-5-fache der nationalen Zwangsvollstreckungsrate, während stabile Märkte mit strengen Kreditnormen (Texas, mit seiner Obergrenze von 80 % Beleihungsauslauf bei Auszahlungs-Refinanzierungen) viel besser abschnitten.
Wie das Risiko variiert
Die Hauptzahl mittelt über sehr unterschiedliche Situationen. So variiert die Wahrscheinlichkeit nach Szenario oder Kontext:
1 zu 5,3 · 19%
~10 million homes foreclosed out of ~52 million mortgaged; driven by subprime lending, negative equity, and lax underwriting
1 zu 385
Annual filing rate 0.23-0.26% of housing units; record homeowner equity and strict post-Dodd-Frank underwriting
1 zu 200
Annual filing rate roughly 0.4-0.6% of housing units before the subprime wave fully hit
Balkenlänge und Schattierung ordnen diese Szenarien untereinander ein, nicht gegenüber anderen Risiken. Die genauen Wahrscheinlichkeiten stehen jeweils daneben.
Verwandte Risiken
Andere Risiken zu ähnlichen Themen — zum Erkunden verwandter Ängste.

Immobilienabsturz
Wie hoch ist die Wahrscheinlichkeit, dass ein großer Immobilienmarktabsturz Ihr Eigenkapital vernichtet?

Subprime-Autokredit-Pfändung
Wenn du einen langfristigen Subprime-Autokredit aufnimmst, wie wahrscheinlich ist es, dass das Auto am Ende gepfändet wird?

Tod in der Hochseefischerei
Wie hoch ist die Wahrscheinlichkeit, im Laufe einer gesamten Karriere als Berufsseefischer zu sterben?

Zwanghafte Kaufstörung
Wie hoch ist die Wahrscheinlichkeit, eine zwanghafte Kaufstörung zu entwickeln?

Währungszusammenbruch
Wie hoch ist die Wahrscheinlichkeit, einen Währungszusammenbruch oder eine Hyperinflation zu erleben?
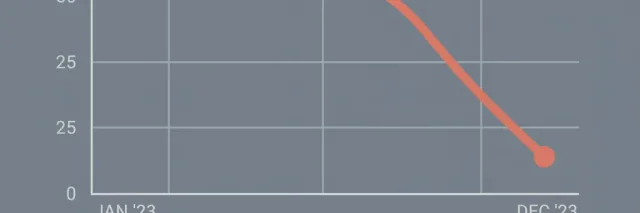
Day-Trading-Verluste
Wie hoch ist die Wahrscheinlichkeit erheblicher finanzieller Verluste beim aktiven Privatanlegerhandel?

Seniorenbetrug-Verlust
Wie wahrscheinlich ist es, dass eine Person ab 60 im Ruhestand Geld durch einen Finanzbetrug verliert?

Extremistische Regierungs-Katastrophe
Wie hoch ist die Wahrscheinlichkeit, dass eine politisch extremistische Regierung Ihr Land katastrophal ruiniert?
Vergleichsrisiko wählen
In 2025, lenders filed foreclosure actions on 367,460 US properties — default notices, scheduled auctions, and bank repossessions combined — representing 0.26% of all housing units. That is 87% below the 2010 peak of nearly 2.9 million filings, and 25% below the pre-pandemic 2019 baseline. Completed foreclosures (actual bank repossessions) numbered just 46,439, down 96% from the 2010 peak of 1,050,500.
These numbers describe a housing market that bears almost no resemblance to the one that generated the trauma most people carry. Between 2006 and 2014, nearly 10 million homeowners lost their homes to foreclosure — roughly one in five of all mortgaged households at the time. The Mortgage Bankers Association’s foreclosure inventory rate peaked at approximately 4.6% of all serviced loans in late 2010; by Q3 2025, it had fallen to 0.50%, near the lowest level since the MBA began tracking the metric.
The gap between perception and current reality is driven by two forces: the vividness of crisis-era imagery and the invisibility of the regulatory response. The Dodd-Frank Act’s Qualified Mortgage rules now require lenders to verify ability to repay, cap debt-to-income ratios, and prohibit the interest-only and no-documentation products that were the proximate cause of most crisis-era defaults. Current homeowners hold a record $17.6 trillion in home equity, with the average mortgaged homeowner sitting on over $300,000 in equity. Negative equity — the single strongest predictor of foreclosure — is nearly absent from the current market.
The only US longitudinal study tracking individual homeowners through a full economic cycle is the BLS analysis of baby boomers born 1957-1964 (NLSY79 cohort), observed from 1988 to 2008. Over that 20-year period, about 7% experienced mortgage delinquency, roughly 2% received a foreclosure notice, and approximately 1.4% actually lost a home. That cohort’s observation window includes the onset of the worst housing crisis in modern history but not its full severity (peak completions ran 2009-2012). Extrapolating to a 30-35 year mortgage exposure window and factoring in the full crisis yields a lifetime estimate in the range of 5-10%, with a central value near 7% — or about 1 in 14 homeowners who carry a mortgage at some point during their adult life.
The strongest individual predictors are not recklessness but vulnerability: the BLS study found that divorce or widowhood and unemployment each more than doubled the probability of delinquency and tripled the probability of foreclosure. The 2008 crisis confirmed this at scale — it was not primarily a story of irresponsible borrowers but of an industry that made credit available on terms that could not survive a downturn, to borrowers whose income margins were too thin to absorb a payment shock. The regulatory apparatus built in response has not eliminated the risk, but it has meaningfully narrowed the channel through which the next crisis would have to flow.
Verwandte Fakten
Etwa 7% der US-Hypotheken enden im Leben in Zwangsvollstreckung. Eine Immobilienkrise wie 2008 hat ~12% Lebenszeit-Wahrscheinlichkeit. Die Zwangsvollstreckungsangst uebersteigt die Grundrate, selbst in Abschwuengen.
7% Lebenszeit-Wahrscheinlichkeit fuer Zwangsvollstreckung. 10% fuer Privatinsolvenz. Es ist wahrscheinlicher, alles zu verlieren als nur das Haus. Keines schafft es in die Finanzplanungsbroschuere.
Quellenregister
Jede Zahl unten ist das, was die jeweilige Quelle berichtet hat — mit dem wörtlichen Zitat, auf das wir uns stützen, und wie wir zu unserer Zahl gelangt sind. Klicke auf einen Link, um direkt zu prüfen.
-
[1] ATTOM Data Solutions — U.S. Foreclosure Activity Increases in 2025
U.S. Foreclosure Activity Increases in 2025- Statistik
367,460 US properties with foreclosure filings in 2025 (0.26% of housing units), up 14% from 2024; 46,439 bank repossessions (REO), up 27% from 2024 but down 96% from the 2010 peak of 1,050,500- Auszug
“"In 2025, foreclosure filings — default notices, scheduled auctions and bank repossessions — were reported on 367,460 U.S. properties, up 14 percent from 2024 and up 3 percent from 2023 but down 25 percent from 2019. Lenders repossessed 46,439 properties through foreclosures (REO) in 2025, up 27 percent from 2024 but down 68 percent from 143,955 in 2019, and down 96 percent from a peak of 1,050,500 in 2010." ”
- Quelldaten von
- 2026-01-15
- Abgerufen
- 2026-04-19 · archivierte Kopie
- Berechnung
- Primary source for the 2025 annual filing count and bank repossession count. 367,460 filings on ~142 million housing units = 0.26% annual filing rate. Completed foreclosures (REO) of 46,439 on ~52 million mortgaged homes = ~0.09% annual completion rate. The gap between filings and completions reflects the multi-stage foreclosure process: many filings are cured through loan modification, short sale, or reinstatement before reaching REO.
- Unabhängigkeit
- ATTOM aggregates county recorder data from over 3,000 counties nationwide. It is the primary private-sector foreclosure tracking source used by industry, media, and researchers. Independent of MBA survey-based data.
-
[2] Mortgage Bankers Association — Mortgage Delinquencies Increase in the Third Quarter of 2025
Mortgage Delinquencies Increase in the Third Quarter of 2025- Statistik
0.50% of mortgage loans in the foreclosure process in Q3 2025; foreclosure starts at 0.20% of serviced loans- Auszug
“"The percentage of loans in the foreclosure process at the end of the third quarter was 0.50 percent, up 2 basis points from the second quarter of 2025 and 5 basis points higher than one year ago. The percentage of loans on which foreclosure actions were started in the third quarter rose by 3 basis points to 0.20 percent." ”
- Quelldaten von
- 2025-11-14
- Abgerufen
- 2026-04-19 · archivierte Kopie
- Berechnung
- MBA's National Delinquency Survey covers roughly 37 million loans, representing about 70% of all first-lien residential mortgages. The 0.50% foreclosure inventory rate and 0.20% foreclosure starts rate confirm the ATTOM data from a different methodology (servicer survey vs county records). The Q3 2025 foreclosure inventory rate of 0.50% is historically low — the peak was approximately 4.6% in Q4 2010.
- Unabhängigkeit
- MBA data is survey-based, collected directly from mortgage servicers, while ATTOM data comes from public county records. The two sources use fundamentally different methodologies and arrive at consistent conclusions.
-
[3] Federal Reserve Bank of St. Louis — The End Is in Sight for the U.S. Foreclosure Crisis
The End Is in Sight for the U.S. Foreclosure Crisis- Statistik
Nearly 10 million mortgage borrowers lost their homes between 2006 and early 2017; the crisis began in Q4 2007 and lasted roughly 10 years- Auszug
“"This nearly 10-year nationwide foreclosure crisis was longer and deeper than anything seen since the Great Depression, with as many as 10 million mortgage borrowers potentially losing their homes." ”
- Quelldaten von
- 2016-12-07
- Abgerufen
- 2026-04-19 · archivierte Kopie
- Berechnung
- Provides the widely cited ~10 million figure for total homes lost during the crisis era. With roughly 50-55 million mortgaged homes at the time, this implies a crisis-era cumulative foreclosure rate of roughly 18-20%. This is the key data point for anchoring the upper bound of the lifetime uncertainty range, since most homeowners will experience at least one major recession during their mortgage-holding years.
- Unabhängigkeit
- St. Louis Fed research draws on ATTOM, CoreLogic, and MBA data but provides independent analytical framing and cumulative estimates not available from any single private source.
-
[4] U.S. Bureau of Labor Statistics — Patterns of homeownership, delinquency, and foreclosure among youngest baby boomers
Patterns of homeownership, delinquency, and foreclosure among youngest baby boomers- Statistik
~7% of the cohort experienced mortgage delinquency; ~2% received a foreclosure notice; ~1.4% lost a home to foreclosure over 20 years (1988-2008)- Auszug
“"Almost 7 percent of the sample and 6 percent of 2008 homeowners were delinquent on mortgage payments over this period. In addition, about 2 percent of homeowners received a foreclosure notice. Divorce or widowhood and unemployment are associated with a greater probability of adverse housing outcomes — there is over twice the chance of delinquency and over three times the chance of receiving a foreclosure notice or losing one's home." ”
- Quelldaten von
- 2013-02-01
- Abgerufen
- 2026-04-19 · archivierte Kopie
- Berechnung
- The only US longitudinal cohort study tracking individual homeowners through a full economic cycle including the Great Recession. The 1.4% actual home-loss rate over 20 years for this cohort sets a floor for the lifetime estimate, since the observation period (1988-2008) includes the onset of the worst foreclosure crisis in modern history but not its full duration (peak completions were 2009-2012). Extrapolating to a 30-35 year mortgage exposure window and adding the 2009-2012 peak years brings the cohort estimate closer to 5-7%.
- Unabhängigkeit
- Uses the National Longitudinal Survey of Youth 1979 (NLSY79), a nationally representative panel survey independent of administrative foreclosure records.
-
[5] ABC News (reporting RealtyTrac year-end data) — 2010 Had Record 2.9 Million Foreclosures
2010 Had Record 2.9 Million Foreclosures- Statistik
2.9 million (2,871,891) US properties received foreclosure filings in 2010, a record annual peak- Auszug
“"In 2010, 2.9 million properties received foreclosure filings -- an increase of 2 percent from 2009 and 23 percent from 2008." ”
- Quelldaten von
- 2011-01-13
- Abgerufen
- 2026-07-03 · archivierte Kopie
- Berechnung
- Substantiates the body prose's "87% below the 2010 peak of nearly 2.9 million filings" comparison. 367,460 (2025 filings, per ATTOM above) is approximately 12.8% of 2,871,891 (2010 filings), i.e. down approximately 87.2% -- consistent with the "87% below" figure in the body prose.
- Unabhängigkeit
- RealtyTrac's contemporaneous 2010 year-end report; RealtyTrac later rebranded as ATTOM Data Solutions (the source of the 2025 filing figures above), so this is the same data lineage at an earlier point in time rather than an independent methodology -- used only to anchor the historical 2010 peak referenced in the body prose.
-
[6] Intercontinental Exchange (ICE Mortgage Technology) — ICE Mortgage Monitor: Record Levels of Home Equity and Falling Rates Drive Highest HELOC Withdraws Since 2008
ICE Mortgage Monitor: Record Levels of Home Equity and Falling Rates Drive Highest HELOC Withdraws Since 2008- Statistik
US mortgage holders carried a record $17.6 trillion in home equity entering Q2 2025; average tappable-equity holder sits on $212K- Auszug
“"U.S. mortgage holders carried a record $17.6 trillion in home equity entering the second quarter of 2025" ... "the average homeowner sitting on $212K [in tappable equity]." ”
- Quelldaten von
- 2025-06-02
- Abgerufen
- 2026-07-03 · archivierte Kopie
- Berechnung
- Substantiates the body prose's "record $17.6 trillion in home equity" figure exactly. The $212K figure quoted in the press release is average TAPPABLE equity (the withdrawable subset while keeping 20% equity), a different and lower metric than the body prose's "over $300,000" average TOTAL equity per mortgaged homeowner claim, which this source does not itself quantify.
- Unabhängigkeit
- Primary mortgage-servicing industry data provider (ICE, formerly Black Knight), the standard source for US mortgage and home-equity data; independent of ATTOM/RealtyTrac (foreclosure filings) and the MBA (delinquency survey) sources above.